ORIGINAL ARTICLE


http://opn.to/a/71nDS

Characterization of the Wind Speed to Design an Aspersion Irrigation System with Eolic Pumping


ABSTRACT

The research was developed in "La Cuchilla" farm, located in the community of Sabicú, “Primero de Enero” Municipality, Ciego de Ávila Province, with the objective of characterizing the wind speed to design a sprinkler irrigation system with pumping wind. The results showed that the value of average monthly speed in the series obtained at “Camilo Cienfuegos” Meteorological Station was greater than 5.50 m s-1 in all months of the year, except in September and October, which was between 3.00 and 3.50 m s-1. The highest wind frequency corresponded to the range of 0-6 m s-1, which represents 72.39%. The wind speed at "La Cuchilla" farm reached an arithmetic mean value of 9.53 m s-1, and a weighted average value of 11.25 m s-1, according to the wind frequency in the months of January, February and March. The wind pumping provided flows between 0.06 and 0.77 L s-1, which allowed storing a total daily volume of 17,640 L in the months of January, February and March.

Keywords

Renewable energy; irrigation; flow; frequency.


INTRODUCTION

Wind energy is that obtained from the wind, that is, the kinetic energy generated by the effect of air currents, and that is transformed into other forms of energy useful for human activities like mechanical and electrical (Soler et al., 2015 and Blanco et al., 2018). Nowadays, it presents a high growth dynamics, so it has been at the forefront of renewable energies (Ávila et al., 2010 and Brown et al., 2018). This energy wind development can be used by the American continent to become a world reference according to Hernández et al. (2013) and Regueiro and Chávez (2014). In this sense, Cuba, in accordance with the policy of the World Wind Energy Association, works with firm steps in the introduction of renewable sources of energy, particularly, wind energy (Moreno, 2008).

The objective of this investigation was characterizing the wind speed, starting from the available information in the meteorological station “Camilo Cienfuegos” and the mensuration carried out during three years, for its later use in the design of a watering system for aspersion with eolic pumping in “Primero de Enero” Municipality, Ciego de Ávila Province

METHODS

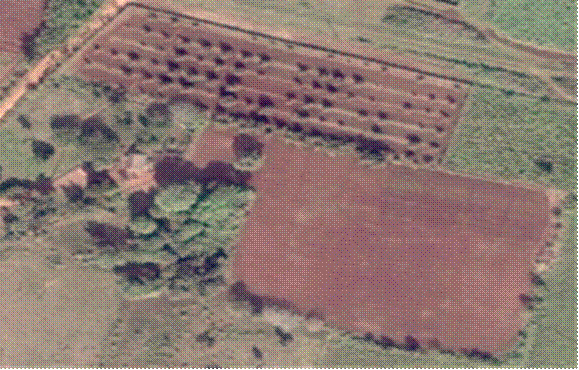
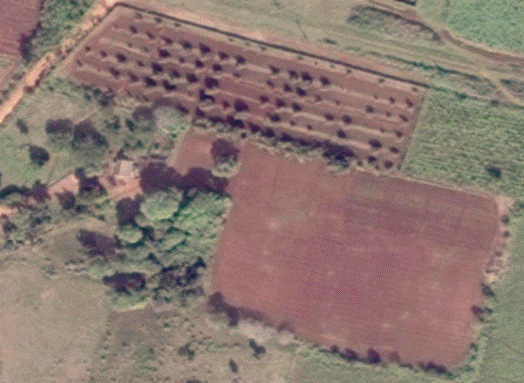
The investigation was carried out in the farm "La Cuchilla", located in the community of Sabicú in “Primero de Enero” Municipality, Ciego de Ávila Province, between the coordinates 21° 52' of north latitude and 78° 18' of west longitude. It has an area of 7.5 hectares with crops such as tomatoes, garlic, beans, corn, cassava, banana, lemon, mango, coconut and others (Figure 1).
2071-0054-rcta-28-04-e07-gf1.gif

FIGURE 1. 

Location of the experimental area.

The investigation analyzed a series of hourly wind speed, measured systematically at “Camilo Cienfuegos” Meteorological Station, which is the closest to “Primero de Enero” Municipality. The measurement schedule was at 1:00 am, 4:00 am, 7:00 am, 10:00 am, 1:00 pm, 4:00 pm, 7:00 pm and 10:00 pm (UTC), between the years 2013 and 2017. The Provincial Meteorological Center provided 14,375 data (Benedico, 2017).

The homogeneity of the series was verified by hypothesis testing through the Fisher "F" test for variances of two subsamples (González et al., 2007, 2014). Subsample A was satisfied with data from 1 to 7,188 and subsample B from data 7,189 to 14,375.

The hypothesis of nullity (H 0 ) and the alternative (H 1 ) were formulated so that if the calculated Fisher "F" test statistic (F) is greater than its critical value (F c ), the decision is made to reject H 0 and accept H 1 ; showing that the compared subsamples differ statistically.

In the experimental area, six daily readings were taken at 7:00 am, 10:00 am, 1:00 pm, 4:00 pm, 7:00 pm and 10:00 pm with the use of a calibrated integral cups anemometer of the mark ΓOCT 7193-74 M/C and accuracy of ± 0.10 m s-1, placed at a height of 10 m. The readings were made twice per week from the year 2016 to 2018 in the months of January, February and March for being the period in which tomato and garlic crops were studied. These assessments formed another series of data with 432 observations.

In both series of wind speed, the monthly and hour behavior of the variable was determined by means of the descriptive and frequency analysis of the data of Serrano (2013), with the use of the Statistical Package for the Social Sciences (SPSS) software, very used in this type of analysis (Sandoval et al., 2017). The winds were classified according to the value of the speed and the Beaufort Scale (López et al., 2008) in: weak winds (0.0-3.0 m s-1), moderate winds (4.0-7.0 m s-1) and strong winds (> 8.0 m s-1).

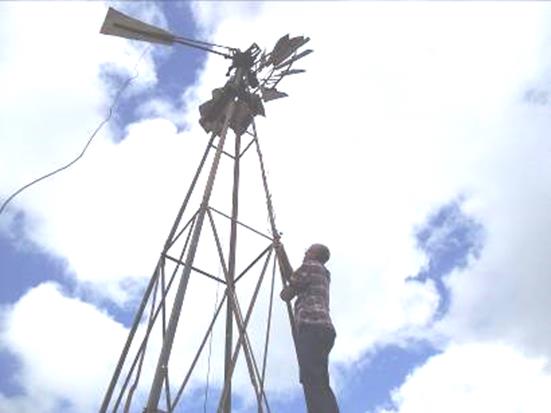
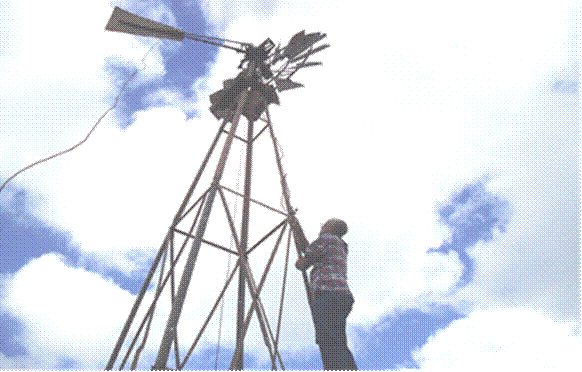
The flow discharged by the multi-blade mill of the brand SAMSON 1888 PAT. D was determined by volumetric measuring according to Rázuri et al. (2009) and Assan et al. (2016), for different wind speeds. The wind pump used is of positive displacement and has the following technical characteristics: tower height (H tor ) 10 m, rotor diameter (D rot ) 2.52 m, number of blades (N pal ) 15, diameter of the pump cylinder (D B ) 80 mm, Stroke length (S) 180 mm and start speed (v arr ) 2.5 m s-1 (Figure 2).
2071-0054-rcta-28-04-e07-gf2.gif

FIGURE 2. 

Multi-blade mill used in wind pumping.

The average daily volume of water extracted by the wind pump was estimated based on the experimental results of the wind speed, the frequency and its relation with the average flow discharged according to the capacity data. The equation used was the following:

Where V m is the average daily volume of water extracted by the wind pump (m3), Q m the average flow rate of the wind pump according to the capacity data (m3 s-1), T B the pumping time according to the relative frequency of the variable (s) and F r the relative frequency of the wind speed in the ranges evaluated (adim.).

RESULTS AND DISCUSSION

Behavior of the Homogeneity of the Rainfall Series

Table 1 shows the results of the homogeneity test from the wind speed series obtained at “Camilo Cienfuegos” Meteorological Station. It was shown statistically that the series is consistent and homogeneous; since the calculated statistician (F) with a value of 1.14 is lower than its critical value (F c ) of 1.28, so alternative hypothesis is declined and nullity hypothesis is accepted.

TABLE 1. 

Homogeneity analysis for the wind speed series

StatisticsSeries A Series B FF c
Average (m s-1)5.334.981.141.28
Variance (m s-1)31.3627.07  
Observations71877186  
Grades of freedom71867185  

Descriptive Analysis of Wind Speed

The descriptive analysis of the wind speed series at “Camilo Cienfuegos” Meteorological Station determined that in the period analyzed, the variable wind speed presented the following characteristics (Table 2): mean of 5.02 m s-1, median of 2.00 m s-1, standard deviation of 6.10 m s-1, minimum value of 0,00 m s-1 and maximum value of 36.00 m s-1.

TABLE 2. 

Descriptive analysis of wind speed

Statistics m s-1Statisticsm s-1
Average5.02Kurtosis1.17
Typical error0.06Coefficient of asymmetry1.32
Median2.00Range36.00
Standard deviation6.10Minimum0.00
Variance of the sample37.23Maximum36.00

Analysis of Wind Speed at “Camilo Cienfuegos” Meteorological Station

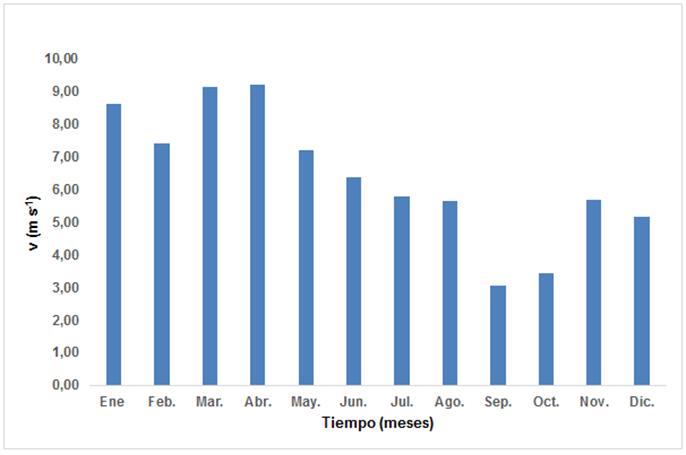
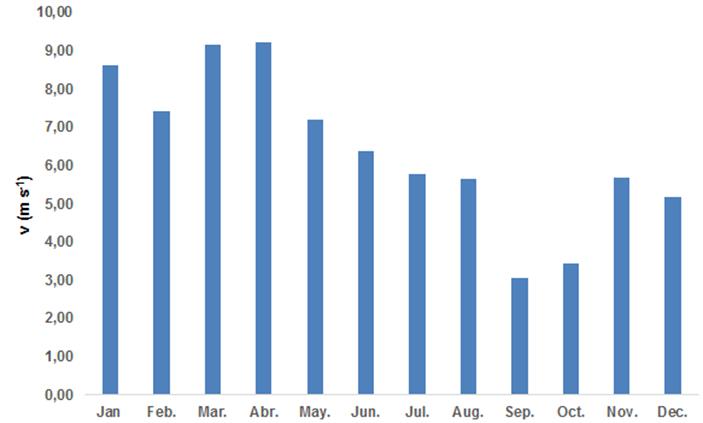
Figure 3 shows the behavior of the average monthly speed with values higher than 5.50 m s-1 in all months of the year, except in September and October that reached values between 3.00 and 3.50 m s-1. These results agree with those reported by Soler et al. (2015) in studies carried out for the characterization of the wind in Isla de la Juventud, where values higher than 4.0 m s-1 were found in the period between 09:00 and 16:00 hours and 5.31 m s-1 at 1:00 p.m.
2071-0054-rcta-28-04-e07-gf3.jpg

FIGURE 3. 

Average monthly wind speed.

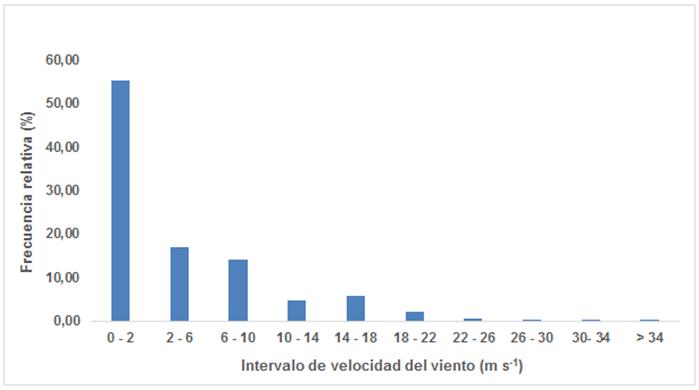
Figure 4 shows the results of the frequency of the wind speed in correspondence with the established intervals. It was found that the highest frequency occurs for speeds between 0-2 m s-1 with 55.28%, followed by speeds of 2-6 and 6-10 m s-1 with 17.11 and 14.20 %, respectively. The frequency in the rest of the speeds was lower than 5.72 %. These values are of great importance for the probabilistic estimation of the number of hours available for pumping water with the multi-blade mill 24 hours a day.
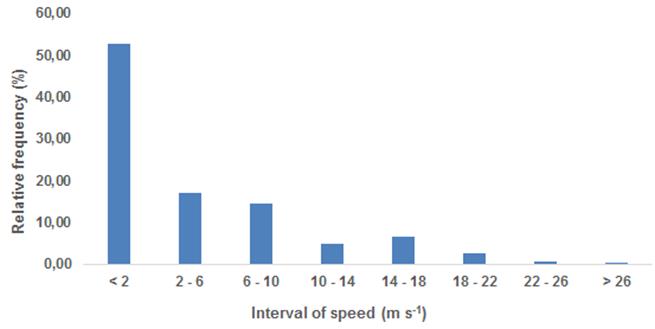
2071-0054-rcta-28-04-e07-gf4.jpg

FIGURE 4. 

Frequency of wind speed.

Analysis of the Wind Speed in the Farm "La Cuchilla"

The frequency distribution of the wind speed measured in the farm "La Cuchilla" during the months of January, February and March is presented in Table 3 for different intervals of the variable in the years 2016, 2017 and 2018. In this study, an arithmetic mean of 9,53 m s-1 was reached, standard deviation of 3.78 m s-1, minimum value of 2.05 m s-1 and maximum value of 22.12 m s-1. The value of the weighted average wind speed considering the frequency corresponding to each speed interval was 11.25 m s-1. These results show, according to López et al. (2008), that it is a zone of strong winds and no period of calm winds was observed, which favors the work of the wind pump in the extraction of water for irrigation.

TABLE 3. 

Frequency distribution of wind speed

Wind speed (m s-1) Relative frequency (%)
201620172018Average (m s-1)
0 - 32.539.605.375.83
4 - 613.6419.7015.3916.24
7 - 921.2118.6920.5220.14
10 - 1426.2634.3432.631.07
15 - 1822.7314.1416.2217.70
19 - 2211.623.037.287.31
23 - 261.520.511.141.06
27 - 300.510.001.480.66
Average (m s-1)10.919.148.559.53
Standard deviation (m s-1)4.103.943.293.78
Minimum (m s-1)2.082.002.102.05
Maximum (m s-1)20.1222.2324.0022.12

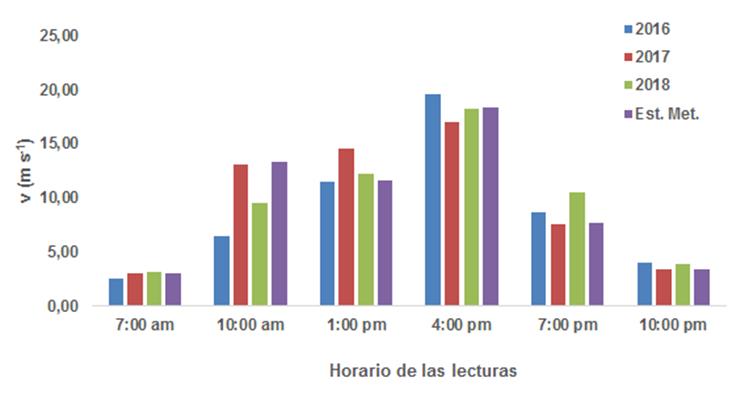
Figure 5 shows the results of the average hourly wind speed in the months from January to March. It was demonstrated that during the twenty-four hours of the day, the winds are usable in a 92.22 % for the pumping of water; although the largest extractions are achieved between 10:00 and 19:00 hours. This behavior is similar to that reported by Galán et al. (2015) in statistical studies of wind speed carried out in Mazatlan, Sinaloa in Mexico.
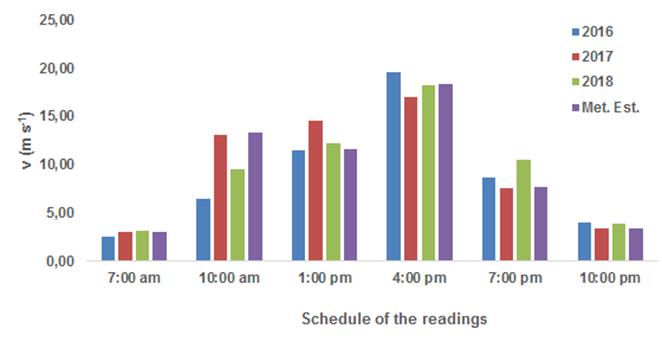
2071-0054-rcta-28-04-e07-gf5.jpg

FIGURE 5. 

Average hourly wind speed in the months from January to March

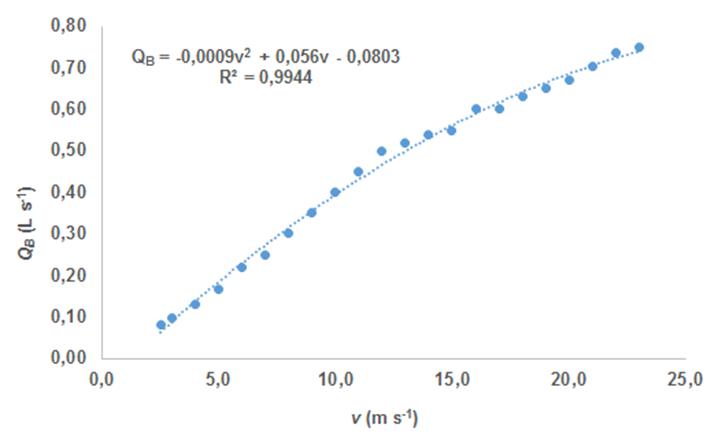
The results of the volumetric measuring of the flow extracted by the wind pump as a function of the wind speed are shown in Figure 6, where it is verified that it reached values between 0.06 and 0.77 L s-1. This relationship found a satisfactory adjustment to the second-order polynomial model with a coefficient of determination of 0.9944.
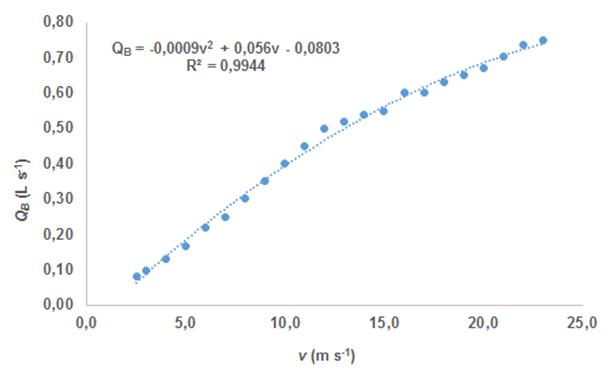
2071-0054-rcta-28-04-e07-gf6.jpg

FIGURE 6. 

Pumping rate as a function of wind speed.

The study of the wind frequency during five years allowed determining, in a probabilistic way, the filling regime of the storage tank (Table 4). This result indicates that in 24 hours, it is possible to store a total volume of 17,640 L of water for use in the irrigation system, in the months of January, February and March. The longest operating time of the wind pump was 12.66 hours in the velocity range of 0-3 m s-1, followed by 4-6 m s-1 and 7-10 m s-1 with a pumping time of four hours in both cases.

TABLE 4. 

Volume of water pumped according to the speed and frequency of the wind

Speed (m s-1) F r T B (h)Q m (L s-1)V m (m3)
0 - 30.5312.660.094.20
4 - 60.174.110.172.48
7 - 100.153.510.283.60
11 - 140.051.190.421.79
15 - 180.071.610.553.20
19 - 220.030.650.691.61
23 - 300.010.280.750.77
Total1.0024.00 17.64

CONCLUSIONS

  • The value of the monthly average speed in the analyzed series was superior to 5.50 m s-1 in every month of the year, except in the months of September and October that was between 3.00 and 3.50 m s-1.

  • The biggest frequency in occurrence of the wind speeds corresponded to the range of 0-6 m s-1 with 72.39%.

  • The wind speed reached an average arithmetic value of 9.53 m s-1, and an average pondered value of 11.25 m s-1, according to the frequency of the wind in the months of January, February and March in the farm "La Cuchilla".

  • The wind pumping provided flows between 0.06 and 0.77 L s-1, what allowed storing a total daily volume of 17,640 L in the months of January, February and March.

 

REFERENCES

ASSAN, M.M.; MARIS, G.S.; DEMIN, P.; DELGADO, E.: “Técnicas de medición de caudales en cauces abiertos”, Revista de Divulgación Técnica, 63: 1-13, 2016, ISSN: 1852-7086.

ÁVILA, P.D.; ALESANCO, G.R.; GARCÍA, G.F.: “Coste del kWh eólico generado en Cuba, a partir de datos de viento de una región de buenos potenciales eólicos”, Ingeniería Mecánica, 13(3): 38-45, 2010, ISSN: 1815-5944.

BENEDICO, R.O.A.: “Resumen meteorológico en síntesis, de la influencia del Huracán de Gran Intensidad IRMA sobre la provincia Ciego de Ávila”, Revista Cubana de Meteorología, 23(3): 378-384, 2017, ISSN: 0864-151X.

BLANCO, E.; BROWN, M.O.; MÁRQUEZ, G.R.: “Vulnerabilidad a la intrusión salina y la contaminación en la cuenca sur de Ciego de Ávila”, Ingeniería Hidráulica y Ambiental, 34(1): 43-57, 2018, ISSN: 1680-0338.

BROWN, M.O.; MÉNDEZ, J.N.; BERNAL, E.M.: “Evaluation of a Micro Irrigation System Powered by Wind Energy”, Revista Ciencias Técnicas Agropecuarias, 27(1): 13-21, 2018, ISSN: 1010-2760, e-ISSN: 2071-0054.

GALÁN, N.; OROZCO, E.; MEJIAS, N.; MELLADO, C.: “Análisis Estadístico de la Velocidad del Viento en Mazatlán Sinaloa”, Revista de Análisis Cuantitativo y Estadístico, 2(4): 288-294, 2015, ISSN: 2410-3438.

GONZÁLEZ, L.; MARRERO, N.; JORGE, M. del C.; MARTÍNEZ, J.: Temas de Hidrología Superficial para Ingenieros, Ed. Félix Varela, La Habana, Cuba, 2007, ISBN: 978-959-07-0310-2.

GONZÁLEZ, S.L.; MARRERO, de L.N.M.; PEDREIRA, J.M.C.; MARTÍNEZ, M.J.B.: Temas de Hidrología Superficial para Ingenieros, Ed. Editorial Universitaria Félix Varela, 2014, ISBN: 959-07-0310-0.

HERNÁNDEZ, O.; MONTAÑO, T.; QUENTIN, E.; MALDONADO, J.; SOLANO, J.: “Homogeneización de series de velocidad del viento mensuales en las estaciones meteorológicas del INAMHI en Loja, Ecuador”, Rev Climatología, 13, 2013.

LÓPEZ, L.J.L.; GONZÁLEZ, G.C.; ZERMEÑO, M.E.; MENDOZA, O.E.; PACHECO, M.J.; ORTIZ, L.J.A.; ARAIZA, G.G.: “Estadística preliminar de los vientos para la zona urbana de Aguascalientes”, Revista Investigación y Ciencia, 16(4): 20-27, 2008, ISSN: 1665-4412.

MORENO, C.: “Cuba en el escenario eólico mundial Reporte sobre la VII Conferencia Mundial de Energía Eólica”, Revista Energía y Tú, 43: 23-24, 2008, ISSN: 1028-9925.

RÁZURI, L.; ROSALES, J.; HERNÁNDEZ, J.: “Formulación de alternativas de uso del agua con base en el balance disponibilidad-demanda en la zona de Santa Rosa, sector La Hechicera del estado Mérida”, Academia, 8(16): 46-64, 2009, ISSN: 1690-3226.

REGUEIRO, F.R.M.; CHAVEZ, A.H.: “El desarrollo eólico en Brasil Ecuador y España: Reflexiones a partir del marco normativo”, Revista de estudios económicos y empresariales, 26: 95-112, 2014, ISSN: 0212-7237.

SANDOVAL, L.M.; JUÁREZ, B.M.I.; BROWN, M.O.; MUJICA, C.A.; BONILLA, R.J.D.; GALLARDO, B.Y.: “Mathematical Models for Flow Estimation in Sutro Weirs Used in Irrigation Systems”, Revista Ciencias Técnicas Agropecuarias , 26(3): 30-38, 2017, ISSN: 1010-2760, e-ISSN: 2071-0054.

SERRANO, R.J.C.: “Comparison of methods for determining Weibull parameters for wind energy generation”, Revista Scientia et Technica, 18(2): 315-320, 2013, ISSN: 0122-1701.

SOLER, T.E.; SÁNCHEZ, S.L.M.; BORREGO, D.R.: “Caracterización del viento para evaluar su potencial energético en la Isla de la Juventud”, Revista Ciencias de la Tierra y el Espacio, 16(2): 164-175, 2015, ISSN: 1729-3790.


Néstor Méndez Jurjo, Profesor, Universidad de Ciego de Ávila (UNICA), Departamento de Ingeniería Civil, municipio y provincia Ciego de Ávila, Cuba, e-mail: nestorm@unica.cu

Oscar Brown Manrique, Profesor Titular, Universidad de Ciego de Ávila (UNICA), Centro de Estudios Hidrotécnicos (CEH), municipio y provincia Ciego de Ávila, Cuba, e-mail: obrown@unica.cu

Jorge Rodríguez Cabrera, Técnico, Empresa Agropecuaria Arnaldo Ramírez, MINAG Primeo de Enero, Ciego de Ávila, Cuba, e-mail: jlrodriguez@nauta.cu

Pablo Antonio Junco Davis, Profesor, Universidad de Ciego de Ávila (UNICA), Departamento de Mecánica Aplicada, municipio y provincia Ciego de Ávila, Cuba, e-mail: pabloa@unica.cu

The authors of this work declare no conflict of interest.

This article is under license Creative Commons Attribution-NonCommercial 4.0 International (CC BY-NC 4.0)

The mention of commercial equipment marks, instruments or specific materials obeys identification purposes, there is not any promotional commitment related to them, neither for the authors nor for the editor.


ARTÍCULO ORIGINAL


Caracterización de la velocidad del viento para el diseño de un sistema de riego por aspersión con bombeo eólico


RESUMEN

La investigación se desarrolló en la finca "La Cuchilla", localizada en la comunidad de Sabicú en el municipio Primero de Enero, provincia Ciego de Ávila con el objetivo de caracterizar la velocidad del viento para el diseño de un sistema de riego por aspersión con bombeo eólico. Los resultados demostraron que el valor de la velocidad media mensual en la serie obtenida en la estación meteorológica Camilo Cienfuegos fue superior a 5,50 m s-1 en todos los meses del año, excepto en septiembre y octubre que estuvo entre 3,00 y 3,50 m s-1. La mayor frecuencia del viento correspondió al rango de 0-6 m s-1 que representa el 72,39%. La velocidad del viento en la finca "La Cuchilla" alcanzó un valor medio aritmético de 9,53 m s-1, y un valor medio ponderado de 11,25 m s-1, según la frecuencia del viento en los meses de enero, febrero y marzo. El bombeo eólico aportó caudales entre 0,06 y 0,77 L s-1, lo que permitió almacenar un volumen diario total de 17640 L en los meses de enero, febrero y marzo.

Palabras clave: 

Energía renovable; irrigación; caudal; frecuencia.


INTRODUCCIÓN

La energía eólica es la que se obtiene del viento, es decir, la energía cinética generada por efecto de las corrientes de aire, y que es transformada en otras formas de energía útiles para las actividades humanas: mecánica, eléctrica (Soler et al., 2015; Blanco et al., 2018). Esta presenta en la actualidad una elevada dinámica de crecimiento; por lo que se ha situado al frente de las energías renovables (Ávila et al., 2010; Brown et al., 2018). Este desarrollo Eolo energético puede ser aprovechado por el continente americano para convertirse en referencia mundial según Hernández et al. (2013; Regueiro y Chávez (2014); en este sentido Cuba, acorde con la política de la Asociación Mundial de Energía Eólica trabaja con pasos firmes en la introducción de fuentes renovables de energías, y en particular la eólica (Moreno, 2008).

El objetivo de esta investigación consiste en caracterizar la velocidad del viento a partir de la información disponible en la estación meteorológica Camilo Cienfuegos y las mediciones realizadas durante tres años, para su posterior utilización en el diseño de un sistema de riego por aspersión con bombeo eólico en el municipio Primero de Enero de la provincia Ciego de Ávila.

MÉTODOS

La investigación se realizó en la finca "La Cuchilla", localizada en la comunidad de Sabicú en el municipio Primero de Enero de la provincia Ciego de Ávila, entre las coordenadas 21°52´ de Latitud Norte y 78°18´ de Longitud Oeste, con una superficie de 7,5 hectáreas donde se desarrollan diferentes cultivos como tomate, ajo, frijoles, maíz, yuca, plátano, limón, mango, coco y otros (Figura 1).

La investigación analizó una serie de velocidad del viento horaria, medida de forma sistemática en la estación meteorológica Camilo Cienfuegos que es la más cercana al municipio Primero de Enero. El horario de medición fue a las 1:00 am, 4:00 am, 7:00 am, 10:00 am, 1:00 pm, 4:00 pm, 7:00 pm y 10:00 pm (UTC) en el periodo comprendido entre los años 2013 al 2017; pudiéndose contar con un total de 14375 datos proporcionado por el Centro Meteorológico Provincial (Benedico, 2017).

2071-0054-rcta-28-04-e07-gf11.gif

FIGURA 1. 

Localización del área experimental.

La homogeneidad de la serie se comprobó mediante la prueba de hipótesis a través del testF” de Fisher para varianzas de dos submuestras (González et al., 2007, 2014). La submuestra A se conformó con los datos del 1 al 7188 y la submuestra B a partir del dato 7189 hasta el 14375.

Se formuló la hipótesis de nulidad (H 0 ) y la alternativa (H 1 ) de modo que si el estadígrafo test “F” de Fisher calculado (F) es mayor que su valor critico (F c ) se toma la decisión de rechazar H 0 y aceptar H 1 ; demostrándose que las submuestras comparadas difieren estadísticamente.

En el área experimental se realizaron seis lecturas diarias a las 7:0 am; 10:00 am; 1:00 pm; 4:00 pm; 7:00 pm y 10:00 pm con el uso de un anemómetro integral de cazoletas calibrado de la marca ΓOCT 7193-74 M/C y precisión de ±0,10 m s-1 colocado a una altura de 10 m. Las lecturas se efectuaron dos veces por semanas desde el año 2016 al 2018 en los meses de enero, febrero y marzo por ser el periodo en que se estudiaron los cultivos de tomate y ajo. Estas evaluaciones conformaron otra serie de datos con un total de 432 observaciones.

En ambas serie de velocidad del viento, el comportamiento mensual y horario de la variable se determinó mediante el análisis descriptivo y frecuencial de los datos de Serrano (2013), con el empleo del software Statistical Package for the Social Sciences (SPSS), muy empleado en este tipo de análisis (Sandoval et al., 2017). Los vientos se clasificaron acorde con el valor de la velocidad según la Escala de Beaufort acorde López et al. (2008) en: vientos débiles (0,0-3,0 m s-1); vientos moderados (4,0-7,0 m s-1) y vientos fuertes (> 8,0 m s-1).

El caudal descargado por el molino multipala de la marca SAMSON 1888 PAT. D se determinó mediante el aforo volumétrico según Rázuri et al. (2009; Assan et al. (2016), para diferentes velocidades del viento. La aerobomba utilizada es de desplazamiento positivo y presenta las siguientes características técnicas: altura de la torre (H tor ) 10 m; diámetro del rotor (D rot ) 2,52 m; número de palas (N pal ) 15; diámetro del cilindro de la bomba (D B ) 80 mm; longitud de la carrera (S) 180 mm y velocidad de arranque (v arr ) 2,5 m s-1 (Figura 2).

El volumen medio diario de agua que extrae la bomba eólica se estimó en función de los resultados experimentales de la velocidad del viento, la frecuencia y su relación con el caudal medio descargado según los datos del aforo. La ecuación empleada fue la siguiente:

Donde V m es el volumen diario medio de agua que extrae la bomba eólica (m3); Q m el caudal medio de la bomba eólica según los datos del aforo (m3 s-1); T B el tiempo de bombeo según la frecuencia relativa de la variable (s); F r la frecuencia relativa de la velocidad del viento en los rangos evaluados (adim.).

2071-0054-rcta-28-04-e07-gf12.jpg

FIGURA 2. 

Molino multipala utilizado en el bombeo eólico.

RESULTADOS Y DISCUSIÓN

Comportamiento de la homogeneidad de la serie de precipitaciones

En la Tabla 1 se presentan los resultados de la prueba de homogeneidad a partir de la serie de velocidad del viento obtenida en la estación meteorológica Camilo Cienfuegos. Se demostró estadísticamente que la serie es consistente y homogénea; puesto que el estadígrafo calculado (F) con valor de 1,14 es menor que su valor crítico (F c ) con valor de 1,28; por lo que se rechaza la hipótesis alternativa y se acepta la hipótesis de nulidad.

TABLA 1. 

Análisis de homogeneidad para la serie de velocidad del viento.

EstadígrafosSerie A Serie B FF c
Media (m s-1).5,334,981,141,28
Varianza (m s-1).31,3627,07  
Observaciones71877186  
Grados de libertad71867185  

Análisis descriptivo de la velocidad del viento

El análisis descriptivo de la serie velocidad del viento en la estación meteorológica Camilo Cienfuegos determinó que en el periodo de tiempo analizado, la variable velocidad del viento presentó las características siguientes (Tabla 2): media de 5,02 m s-1, mediana de 2,00 m s-1, desviación estándar de 6,10 m s-1, valor mínimo de 0,00 m s-1 y valor máximo de 36,00 m s-1.

TABLA 2. 

Análisis descriptivo de la velocidad del viento

Estadígrafo m s-1Estadígrafom s-1
Media.5,02Curtosis.1,17
Error típico.0,06Coeficiente de asimetría.1,32
Mediana.2,00Rango.36,00
Desviación estándar.6,10Mínimo.0,00
Varianza de la muestra.37,23Máximo.36,00

Análisis de la velocidad del viento en la estación meteorológica Camilo Cienfuegos

En la Figura 3 se muestra el comportamiento de la velocidad media mensual con valores superiores a 5,50 m s-1 en todos los meses del año, excepto en los meses de septiembre y octubre que alcanzaron valores entre 3,00 y 3,50 m s-1. Estos resultados concuerdan con los reportados por Soler et al. (2015) en estudios realizados para la caracterización del viento en la Isla de la Juventud donde se encontraron valores superiores a 4,0 m s-1 en el periodo entre las 09:00 y 16:00 horas y de 5,31 m s-1 a las 13:00 horas.

2071-0054-rcta-28-04-e07-gf13.jpg

FIGURA 3. 

Velocidad media mensual del viento.

En la Figura 4 se exponen los resultados de la frecuencia de la velocidad del viento en correspondencia con los intervalos establecidos. Se pudo comprobar que la mayor frecuencia ocurre para velocidades comprendidas entre 0-2 m s-1 con el 55,28%, seguido por las velocidades de 2-6 y 6-10 m s-1 con 17,11 y 14,20% respectivamente. La frecuencia en el resto de las velocidades fue inferior a 5,72%. Estos valores son de gran importancia para la estimación probabilistica de la cantidad de horas disponible para el bombeo de agua con el molino multipala durante las 24 horas del día.

2071-0054-rcta-28-04-e07-gf14.jpg

FIGURA 4. 

Frecuencia de la velocidad del viento.

Análisis de la velocidad del viento en la finca "La Cuchilla"

La distribución de frecuencia de la velocidad del viento medida en la finca "La Cuchilla" durante los meses de enero, febrero y marzo se presenta en la Tabla 3 para diferentes intervalos de la variable en los años 2016, 2017 y 2018. En este estudio se alcanzó una media aritmética de 9,53 m s-1, desviación estándar de 3,78 m s-1, valor mínimo de 2,05 m s-1 y valor máximo de 22,12 m s-1. El valor de la velocidad media ponderada del viento considerando la frecuencia correspondiente a cada intervalo de velocidad fue de 11,25 m s-1. Estos resultados demuestran según López et al. (2008) que que se trata de una zona de vientos fuertes y no se observaron período de vientos en calma, lo que favorece la labor de la aerobomba en la extracción de agua para el riego.

TABLA 3. 

Distribución de frecuencia de la velocidad del viento

Velocidad del viento (m s-1) Frecuencia relativa (%)
201620172018Promedio (m s-1)
0 - 32,539,605,375,83
4 - 613,6419,7015,3916,24
7 - 921,2118,6920,5220,14
10 - 1426,2634,3432,631,07
15 - 1822,7314,1416,2217,70
19 - 2211,623,037,287,31
23 - 261,520,511,141,06
27 - 300,510,001,480,66
Promedio (m s-1)10,919,148,559,53
Desviación estándar (m s-1)4,103,943,293,78
Mínimo (m s-1)2.082,002,102,05
Máximo (m s-1)20,1222,2324,0022,12

En la Figura 5 se ofrecen los resultados de la velocidad media horaria del viento en los meses de enero a marzo. Se demostró que durante las veinticuatro horas del día los vientos son aprovechables en un 92,22% para el bombeo de agua; aunque las mayores extracciones se logran entre las 10:00 y las 19:00 horas. Este comportamiento es similar al expuesto por Galán et al. (2015) en estudios estadístico de la velocidad del viento realizado en Mazatlán, Sinaloa en México.

2071-0054-rcta-28-04-e07-gf15.jpg

FIGURA 5. 

Velocidad media horaria del viento en los meses de enero a marzo.

Los resultados del aforo volumétrico del caudal extraído por la bomba eólica en función de la velocidad del viento se muestran en la Figura 6, donde se comprueba que este adquiere valores de 0,06 a 0,77 L s-1. Esta relación encontró un satisfactorio ajuste al modelo polinomial de segundo orden con un coeficiente de determinación de 0,9944.

2071-0054-rcta-28-04-e07-gf16.jpg

FIGURA 6. 

Caudal de bombeo en función de la velocidad del viento.

El estudio de la frecuencia del viento durante cinco años permitieron determinar de forma probabilística el régimen de llenado del tanque de almacenamiento (Tabla 4). Este resultado indica que en un tiempo de 24 horas es posible almacenar en los meses de enero, febrero y marzo un volumen total de 17640 L de agua para su utilización en el sistema de riego. El mayor tiempo de funcionamiento de la aerobomba fue de 12,66 horas en el rango de velocidades de 0-3 m s-1; seguido de 4-6 m s-1 y 7-10 m s-1 con un tiempo de bombeo de cuatro horas en ambos casos.

TABLA 4. 

Volumen de agua bombeada en función de la velocidad y la frecuencia del viento

Velocidad (m s-1)F r T B (h)Q m (L s-1)V m (m3)
0 - 30,5312,660,094,20
4 - 60,174,110,172,48
7 - 100,153,510,283,60
11 - 140,051,190,421,79
15 - 180,071,610,553,20
19 - 220,030,650,691,61
23 - 300,010,280,750,77
Total1,0024,00 17,64

CONLUSIONES

  • El valor de la velocidad media mensual en la serie analizada fue superior a 5,50 m s-1 en todos los meses del año, excepto en los meses de septiembre y octubre que estuvo comprendida entre 3,00 y 3,50 m s-1.

  • La mayor frecuencia de ocurrencia de las velocidades del viento correspondió al rango de 0-6 m s-1 con el 72,39%.

  • La velocidad del viento alcanzó un valor medio aritmético de 9,53 m s-1, y un valor medio ponderado de 11,25 m s-1 , según la frecuencia del viento en los meses de enero, febrero y marzo en la finca "La Cuchilla".

  • El bombeo eólico aportó caudales entre 0,06 y 0,77 L s-1, lo que permitió almacenar un volumen diario total de 17 640 L en los meses de enero, febrero y marzo.