ORIGINAL ARTICLE


http://opn.to/a/npYin

Evaluation of Methods to Calculate Dynamic Load Coefficients


ABSTRACT

Dynamic forces and impact loads usually act on agricultural machines, causing breakages or failures. That is due to the nature of the impact loads, which are of short duration and decrease the capacity of the material of absorbing the deformation energy. The calculation methods that allow obtaining dynamic load coefficients require complex operations. In the present investigation, three methodologies for obtaining dynamic load coefficients were evaluated and compared: analytical method (MA), numerical simulation by the finite element method (MEF) and experimental method (Mexp). The coefficients of dynamic loads obtained from the MEF reached a relative difference that oscillated between 3.479 and 5.112%, based on the experimental results. For the analytical method, comparedto the experimental results, a relative difference between 21.820 and 27.201% was reached, which is higher than that obtained by the numerical simulation method.

Keywords: 

elements; dynamic efforts; Impact loads; border conditions.


INTRODUCTION

Precise and scientifically justified calculations of dynamic load coefficients guarantee efficient designs and a considerable saving of materials in the manufacture of prototypes.

The determination of the stresses caused by the dynamic loads is complex depending on factors such as contact area in the impact and the variation process of the contact forcesas a function of time. In this sense, most dynamic cases are quantify experimentally and for simple calculations, equivalent static charges are used. The determination of the coefficients of dynamic loads in structures subjected to impact actions, using analytical methods, represents a challenge due to their high complexity.

The method of finite elements, as a numerical method of computer-assisted discretization, is an alternative way to the analytical method of continuous medium analysis, which facilitates the solution of complex engineering problems, being considered a tool of undoubted practical value and great application worldwide. There are important results derived from the use of this method, among them the ones reported by Martínez et al. (2007); Liu et al. (2013) and Untaroiu et al.(2013). Also, those referred by Vavalle et al. (2013); Feng & Aymerich (2014); Nadal et al. (2014); Zhanbiao et al. (2014); Singh & Singh (2015); Zhao et al. (2015); Kong et al. (2016); Xiaofei et al.(2016) and Castro & Güiza (2017).

The objective of this work was to evaluate and compare three methodologies for determining dynamic load coefficients: the traditional analytical method (MA), the numerical simulation based on the finite element analysis (MEF) and the experimental method (Mexp), taking this last as a comparison and validation pattern of the theoretical methods.

METHODS

A multifactorial type design was used, using two factors as independent variables that correspond to the height and the impact load, with ten and three levels, respectively. The impact height levels were from 0 to 1 m with intervals of 0.1 m and the load levels were 25; 400 and 800 N.

For the three methods analyzed, the coefficient of dynamic loads was determined starting from the determination of the static deflection produced on a mechanical system taken as an object of study under the action of static charges with a magnitude equal to the weight of a body that impactsince a certain height. Once the maximum static deflections of the system under study were determined, the coefficient of dynamic loads was determined using the expression according to Pisarenko and Yakovlev (1979):

where:

kd

- Coefficient of dynamic loads;

δ est

- Deflection or maximum static arrow, which also depends on the solicitation scheme and the support conditions;

H

- Height of fall of the body that impacts on the system under study.

In this work, the static deflection of the system under study was determined by the three mentioned methods: the traditional analytical method of the mechanics of materials; the method of finite elements and the experimental method.

Description of the Mechanical System under Study

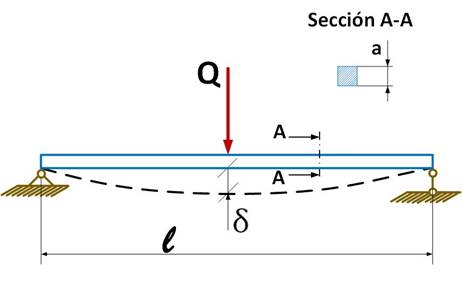
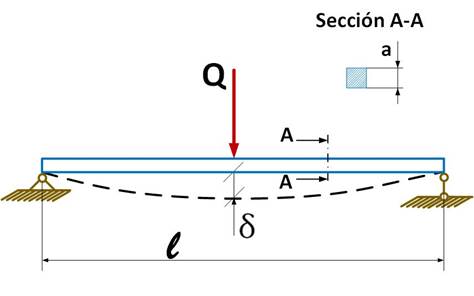
As a study object, a beam of square cross section (Table 1) was used in horizontal position and supported at its ends with a joint and a simple support, as shown in Figure 1. In the center of the beam, three levels of load Q (25, 400 and 800 N) were applied to provoke different levels of static deflections (δ). In Table 2, the mechanical properties of the material are shown.

TABLE 1. 

Description of the system under study

Cross sectionSide, mmMass, kgMoment of inertia, m4Length, mmActing load, N
Square39.09121.95*10-71000From 25 to 800 at the interval of 25

2071-0054-rcta-28-04-e03-gf1.jpg

FIGURE 1. 

Descriptive scheme of the system under study.

TABLE 2. 

Physical mechanical properties of the beam material

DescriptionValue
Modulus of elasticity200 000 MPa
Poissoncoefficient0.29
Density of mass7900 kgm-3
Limittotraction420.507 MPa
ElasticLimit351.561 MPa

Determination of Static Deflections by the Traditional Analytical Method

For the case under study, consisting of a horizontal beam simply supported when the application of the load is made in the center of the beam and the maximum static arrow is given by the expression:

where:

Q

- mg: weight of the impacting element, kg ms-2

l

- length of the beam, m

E

- modulus of elasticity of the beam material

J

- moment of inertia of the section of the beam
2071-0054-rcta-28-04-e03-gf2.jpg

FIGURE 2. 

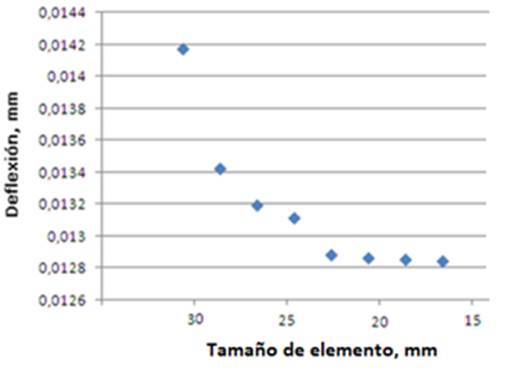
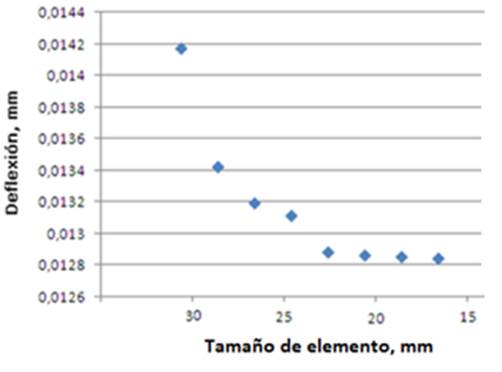
Convergence analysis to determine the characteristics of the mesh.

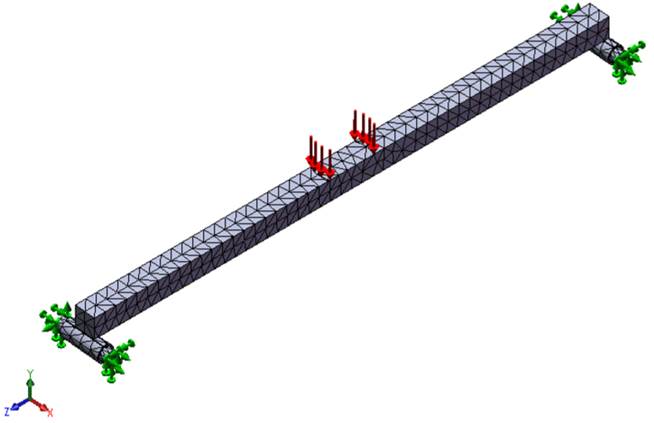
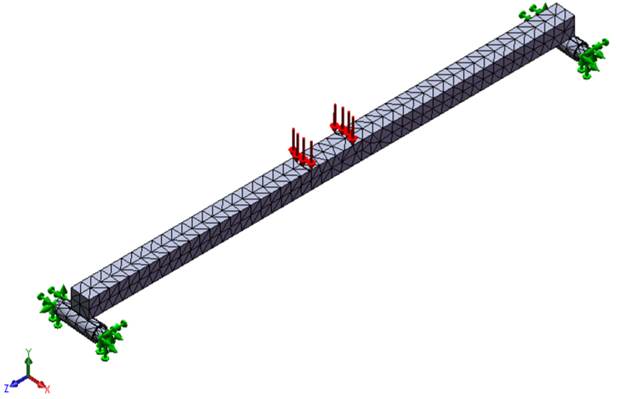
From the element size, the rest of the properties of the mesh are established (Table 3). In Figure 3, a 3D view of the model of the beam with the resulting meshing and boundary conditions is shown, where the restrictions (green arrows) and the statically applied load (red arrows) are represented.

TABLE 3. 

Characteristics of the mesh used in the analysis

ParametersMeshQualityToleranceNumber of nodesNumber of elementsSize of elements
DescriptionSolid, StandardHigh0.05 mm4,3402,34220 mm

2071-0054-rcta-28-04-e03-gf3.jpg

FIGURE 3. 

3D model of the beam with the representation of the boundary conditions.

Description of the Experimental Method Used

The experimental determination of the static deformations that allowed determining the coefficients of dynamic loads of the system studied, under different dynamic loads, was carried out by means of electrical extensometry techniques.

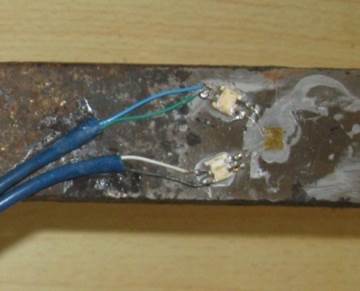
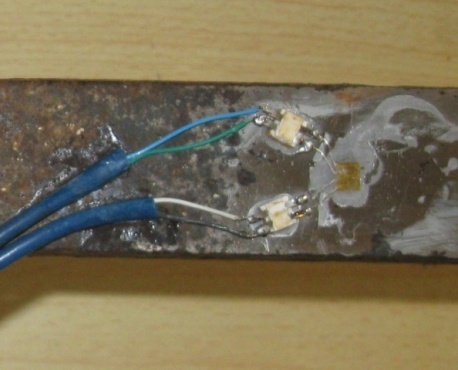
On the underside of the center of the beam studied,strain gauges were placed (Figure 4) configured in a quarter of Wheatstone bridge, with the aim of obtaining voltage signals proportional to the unitary deformation (considering the deformations within the elastic limit of the material), produced by static charges of different magnitude. The static charges were obtained by placing weights of 25 N; 400 N and 800 N in the center of the beam and recording the output voltage (eest) of the measurement system. In a similar way, the output voltage (edin) produced by the same applied loads was recorded, dropping the same weights from different heights between 0.1 and 1 m to the center of the beam. For each treatment, three repetitions were made. The quotient of the voltages obtained, for each of the loads and heights applied, allowed obtaining the coefficient of dynamic loads in each case, applying the expression:

where

eest

- is the voltage registered under the action of the loads applied in static form;

e din

- is the maximum voltage under the action of the loads applied dynamically (when dropping the weights from different heights);

ε est and ε din

- are the unit deformations corresponding to the static and dynamic loads, respectively;

σ est and σ din

- are normal stresses corresponding to static and dynamic loads, respectively.
2071-0054-rcta-28-04-e03-gf4.jpg

FIGURE 4. 

Strain gages stuck on the underside of the beam.

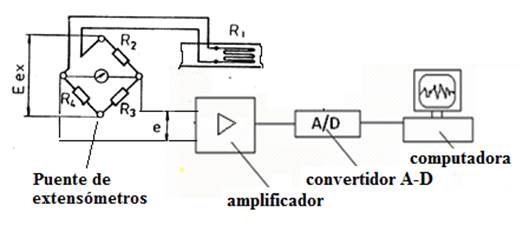
The signals coming from the strain gauges (of the order of the mV), were processed in a dynamic amplifier, model KYOWA-YA-520 with amplification modules of type DPM-602B, being amplified up to voltage levels between ± 5V.

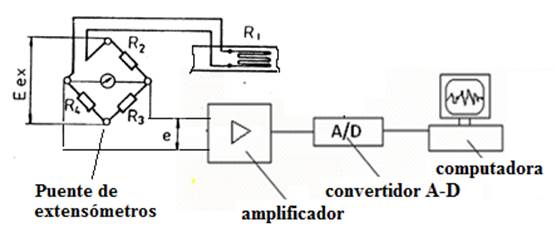
The analog signal coming from the amplifier (Figure 5) was digitalized in an analog-digital converter model NATIONAL INSTRUMENTS - NI USB-4431 and introduced at a rate of 100 samples per second in a laptop computer for further statistical processing.
2071-0054-rcta-28-04-e03-gf5.jpg

FIGURE 5. 

Diagram of the instrumentation used during the registration of the signals proportional to the deformation of the beam.

RESULTS AND DISCUSSION

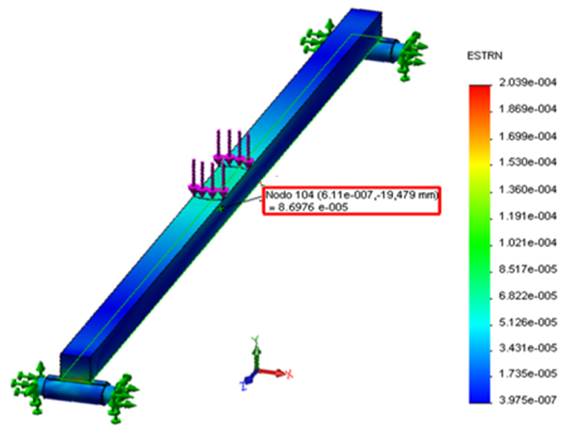
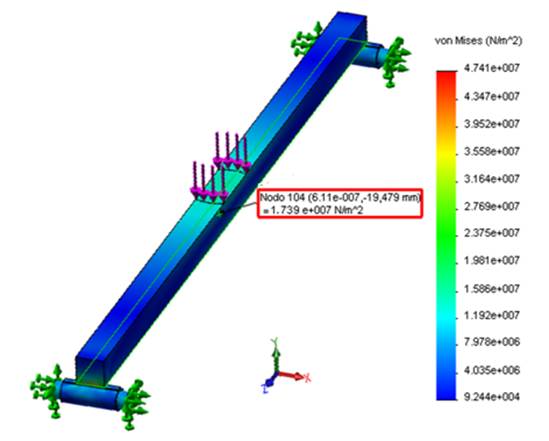
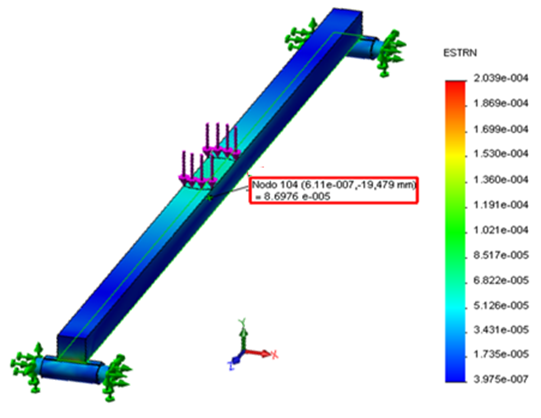
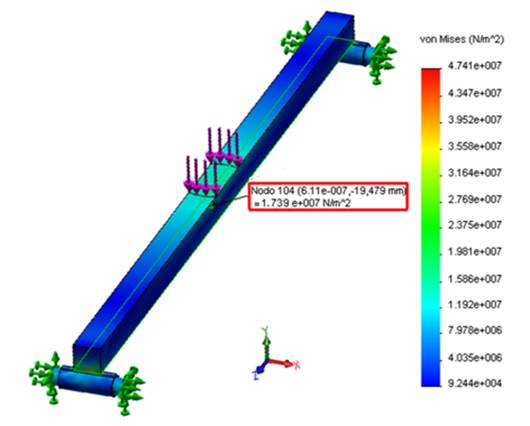
Figure 6 shows one of the outputs of the static analysis by the MEF to determine the unit deformation of the beam under study. When the beam is subjected to 800 N static load, it is observed that the value of the unit strain is 86.976 μstrain, while the result of the stress for that same load value is shown in Figure 7, where it reached a value of 17.3952 MPa.
2071-0054-rcta-28-04-e03-gf6.png

FIGURE 6. 

Deformations in the center of the beam under the action of a static load of 800 N.
2071-0054-rcta-28-04-e03-gf7.jpg

FIGURE 7. 

Stress in the center of the beam under the action of a static load of 800 N.
2071-0054-rcta-28-04-e03-gf8.jpg

FIGURE 8. 

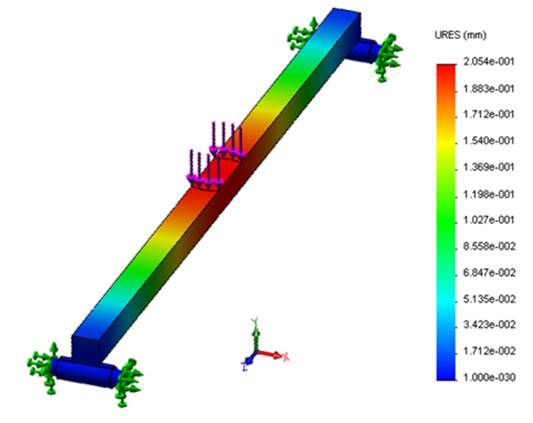
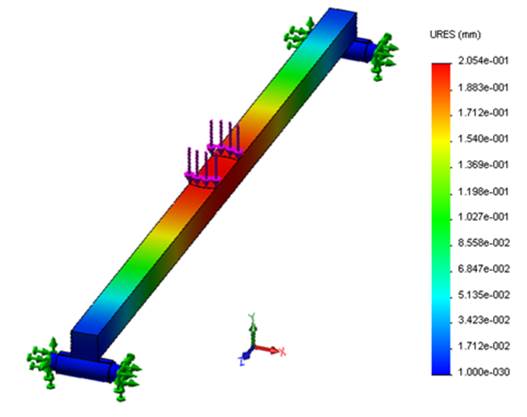
Deflection of the beam in the vertical direction for a static load of 800 N by analysis with the finite element method.

Experimental Evaluation of the Numerical Simulation

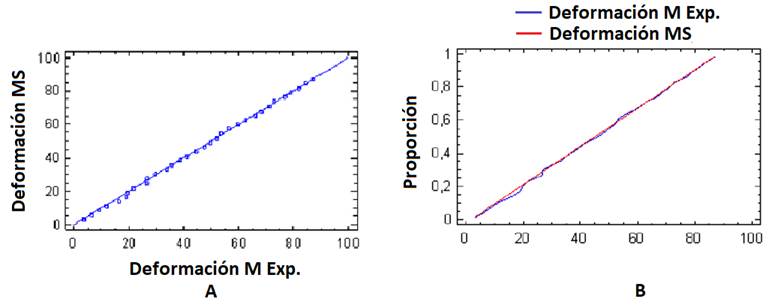
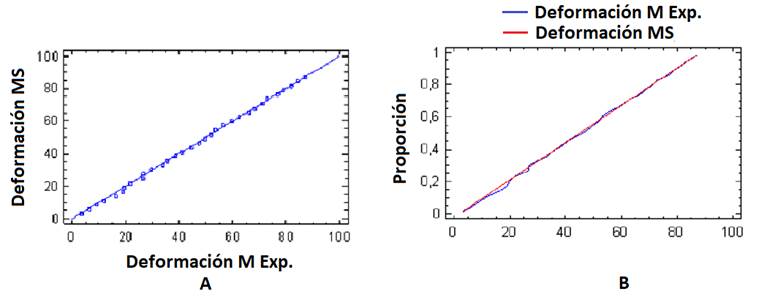
Figure 9 shows two graphs with the cumulative distribution of the deformations predicted with the model analyzed by the MEF and the experimental results. The data obtained showed that the maximum distance between the accumulated distributions of the two samples is 0.03125 μstrain, where the approximate p-value obtained is greater than 0.05, so there is no statistically significant difference between the two distributions for a confidence level of 95%. It was observed that the data obtained for the stresses predicted with the model analyzed by MEF and those calculated from experimental tests coincide with the results obtained for the deformation, this is because the stresses are calculated from the deformations using the law of Hooke.
2071-0054-rcta-28-04-e03-gf9.jpg

FIGURE 9. 

Accumulated distribution (A) and distribution function (B) between the deformations predicted by the simulation and those obtained experimentally.

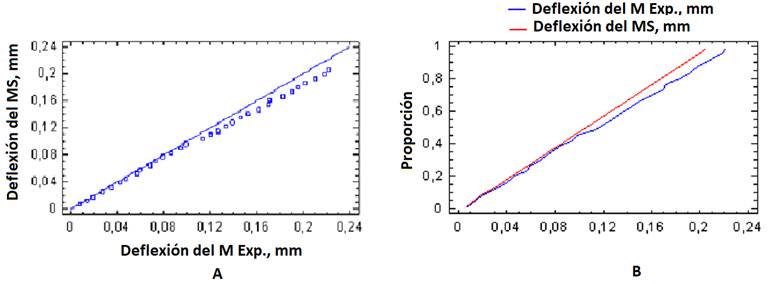
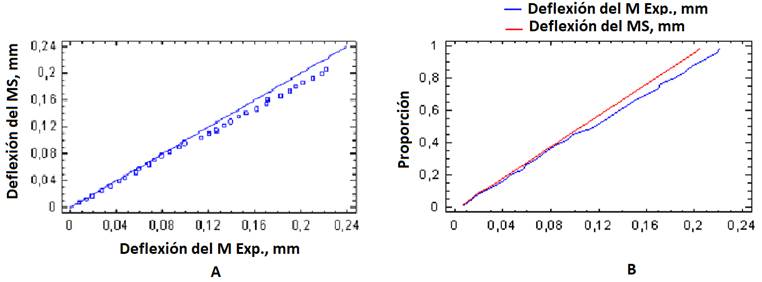
Figure 10 shows the cumulative distribution graph to compare the deflections predicted with the model analyzed by MEF and the experimental results, which shows that the maximum distances between the accumulated distributions of the two samples are of 0.09375 mm. For the behavior of the predicted and experimental deflection values, an approximate p-value of 0.998965 was obtained. Since it is greater than 0.05, there is no statistically significant difference between the two distributions for a 95% confidence level.
2071-0054-rcta-28-04-e03-gf10.jpg

FIGURE 10. 

Accumulated distribution (A) and distribution function (B) between deflections predicted by the simulation and those obtained experimentally.

Result of the Coefficients of Dynamic Loads by the Three Methods Studied

Table 4 shows the results of the determination of the dynamic load coefficients by the different methods studied and the relative difference between the methods and the experimental results. It can be seen that the relative difference of the MEF ranged between 3.479 and 5.112%, being substantially lower than the values ​​obtained by the analytical method (MA), which ranged from 21.820 to 27.201%.

The dynamic load coefficients reached values ​​of 391.203 for the analytical case (MA), of 501.001 for the experimental case and a value of 528.047 for when the dynamic load coefficients were calculated from the data obtained via numerical simulation by the method of the finite elements (MEF), with a load of 25 N. The highest values ​​of the coefficients of dynamic loads in the three calculation methods were recorded for the highest height studied (1 m) and with the lowest of the loads applied (25 N). For the same impact height it was determined that the highest values ​​of dynamic load coefficients were recorded for the lower mass impact loads (25 N). At the same impact height, the lowest dynamic load coefficients were obtained while the impact load was greater. The case that the highest coefficient values ​​of dynamic loads were recorded for the lower load is because the increase in the mass of the hitting element causes greater deflections, therefore, the coefficient of dynamic loads decreases, due to its inversely proportional relationship.

TABLE 4. 

Relative differences of the dynamic load coefficients by both methods métodos

Impactheight; mImpact load; NCoefficients of dynamicloads Relativedifference
(MA)(M Exp.)(MEF)MA-MExp; %MEF- MExp; %
0.125124.397159.117167.6221.8205.344
40031.86442.89745.14125.7205.231
8002331.09932.2226.0433.605
0.225175.51224.61236.70421.8605.384
40044.63760.24363.41725.9055.269
8003243.55545.14126.5303.641
0.325214.725274.863289.67721.8795.390
40054.4473.55577.44125.9875.283
80038.79453.11555.05726.9623.656
0.425247.787317.229334.33521.8905.392
40062.70484.77789.26526.0375.294
80044.63761.17463.41727.0333.667
0.525276.916354.555373.67921.8985.394
40069.98694.66499.68226.0695.301
80049.78568.27570.78227.0823.672
0.625303.251388.3409.2521.9035.395
40076.569103.603109.126.0945.306
80054.4474.69477.44127.1163.678
0.725327.468419.331441.9621.9075.396
40082.623111.823117.7626.1135.309
80058.7280.59883.56527.1453.681
0.825350.009448.215472.40621.9105.397
40088.258119.474125.82126.1285.312
80062.70486.09389.26527.1673.684
0.925371.468475.343501.00121.8535.398
40093.55126.66133.39326.1415.316
80066.44691.25494.61827.1863.686
125391.203501.001528.04721.9165.398
40098.556133.457140.55426.1515.318
80069.98696.13699.68227.2013.689

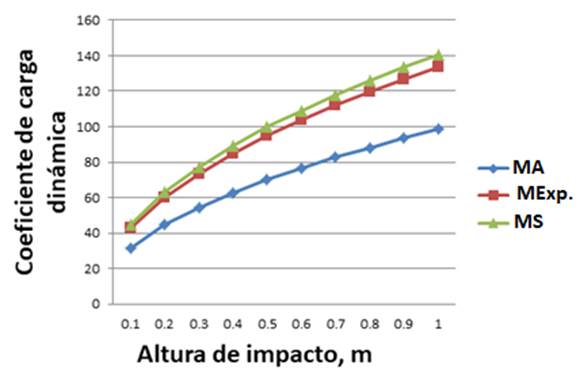
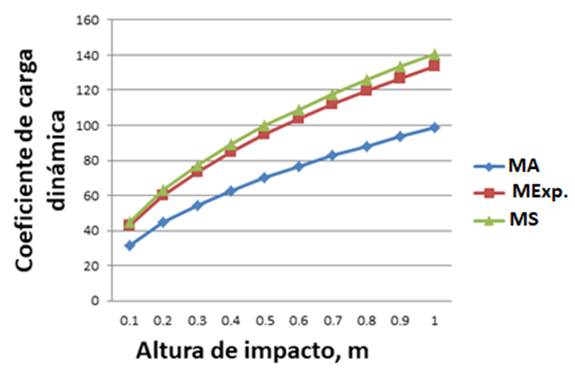
Figure 11 shows the behavior of the dynamic load coefficients by the three methods studied for an impact load of 400 N. The range of impact heights was from 0.2 to 1 m. It is observed that the behavior curve obtained by the MEF was the closest to that obtained by MExp. The results obtained by numerical simulation (MEF), gave better results and this is due to the advantage that the finite elements method offers before the analytical methods, which allows simulating the system more realistically, taking into account a greater number of factors during the simulation. The analytical processes are simplified and they are of great practical value to design innumerable systems, but theydo not allow knowing the detailsof the structural behavior under real actions.

Coinciding with the results obtained, Aparicio & Casas (1987)point out that in the interpretation of the results of tests of impact loads, it is important to know aspects that are not considered in the analytical studies. It is also vital to know the details of the phenomenon when they take into account the deflection of automobile structures to see their impact on the comfort and safety of passengers (Álvarez et al., 1983). On the other hand, Beltrán and Cerrolaza (1989), state that it is necessary to resort to more sophisticated calculation models that allow reproducing more accurately the real behavior of different systems.
2071-0054-rcta-28-04-e03-gf11.jpg

FIGURE 11. 

Behavior of dynamic load coefficients for a load of 400 N.

CONCLUSIONS

  • The numerical simulation compared with experimental data for deformations and stresses reached a p-value greater than 0.05, so there was no statistically significant difference between the two distributions for a confidence level of 95%.

  • For the deflections predicted through the model analyzed by MEF and the experimental results, an approximate p-value of 0.99 was reached, so there was no statistically significant difference between the two distributions.

  • The relative difference between the coefficients of dynamic loads by experimental method (MExp.) and by numerical simulation (MEF) ranged between 3.479 and 5.122%, being substantially lower than the values obtained by the analytical method (MA), which reached values from 21.820 to 27.201%.

 

REFERENCES

ÁLVAREZ, R.; MOLINA, R.F.J.; DOBLARÉ, C.M.; ALARCÓN, E.: “Interacción dinámica vehículo-vía-estructura-cimiento en puentes de ferrocarril”, En: Anales de Ingeniería Mecánica, Ed. Asociación Española de Ingeniería Mecánica; Universidad de Cantabria (Dpto, vol. 1, pp. 451-460, 1983, ISBN: 0212-5072.

APARICIO, A.; CASAS, J.R.: “Resultados y conclusiones de las pruebas efectuadas en el paso superior de Alfonso X, en el Cinturón de Ronda de Barcelona: Una fuente de enseñanza”, Hormigón y acero, 162: 33-141, 1987.

BELTRÁN, F.; CERROLAZA, M.: “Análisis dinámico de estructuras sometidas a cargas no lineales”, Revista internacional de métodos numéricos para cálculo y diseño en ingeniería, 5(4): 473-502, 1989, ISSN: 1886-158X.

CASTRO, D.; GÜIZA, R.: Análisis del efecto de una grieta en el comportamiento estructural de una biela usando FEA, ser. Engineering Sciences [physics]/ Mechanics [physics.med-ph]/ Mechanics of the structures [physics.class-ph], Inst. Grupo de Investigación en Energía y Medioambiente (GIEMA). Universidad Industrial de Santander, Colombia, Colombia, 2017.

FENG, D.; AYMERICH, F.: “Finite element modelling of damage induced by low-velocity impact on composite laminates”, Composite Structures, 108: 161-171, 2014, ISSN: 0263-8223, DOI: https://doi.org/10.1016/j.compstruct.2013.09.004.

KONG, Y.S.; ABDULLAH, S.; OMAR, M.Z.; HARIS, S.M.: “Failure assessment of a leaf spring eye design under various load cases”, Engineering Failure Analysis, 63: 146-159, 2016, ISSN: 1350-6307, DOI: https://doi.org/10.1016/j.engfailanal.2016.02.017.

LIU, T.; FLECK, N.A.; WADLEY, H.N.G.; DESHPANDE, V.S.: “The impact of sand slugs against beams and plates: Coupled discrete particle/finite element simulations”, Journal of the Mechanics and Physics of Solids, 61(8): 1798-1821, 2013, ISSN: 0022-5096, DOI: https://doi.org/10.1016/j.jmps.2013.03.008.

MARTÍNEZ, R.A.; BOZA, M.Y.; LASTRA, M.D.; BARROSO, P.P.: “Análisis modal del sistema fruto-pedúnculo del Nim”, Revista Ciencias Técnicas Agropecuarias, 16(3): 43-46, 2007, ISSN: 1010-2760, e-ISSN: 2071-0054.

NADAL, E.; RÓDENAS, J.J.; SÁNCHEZ, O.E.M.; LÓPEZ, R.S.; MARTÍ, P.J.: “Sobre la utilización de códigos de elementos finitos basados en mallados cartesianos en optimización estructural”, Revista internacional de métodos numéricos para cálculo y diseño en ingeniería , 30(3): 155-165, 2014, ISSN: 0213-1315, DOI: https: //doi.org/10.1016/j.rimni.2013.04.009.

PISARENKO, G.S.; YAKOVLEV, A.P.: Manual de resistencia de materiales, Ed. Mir Publishers, Primera ed., Moscú, Rusia. URSS, 1979.

SINGH, N.K.; SINGH, K.K.: “Review on impact analysis of FRP composites validated by LS‐DYNA”, Polymer Composites, 36(10): 1786-1798, 2015, ISSN: 0272-8397, DOI: 10.1002/pc.23064.

UNTAROIU, C.D.; YUE, N.; SHIN, J.: “A finite element model of the lower limb for simulating automotive impacts”, Annals of biomedical engineering, 41(3): 513-526, 2013, ISSN: 0090-6964, DOI: 10.1007/s10439-012-0687-0.

VAVALLE, N.A.; MORENO, D.P.; RHYNE, A.C.; STITZEL, J.D.; SCOTT, G.F.: “Lateral impact validation of a geometrically accurate full body finite element model for blunt injury prediction”, Annals of biomedical engineering , 41(3): 497-512, 2013, ISSN: 0090-6964, DOI: https://doi.org/10.1007/s10439-012-0684-3.

WARRENDALE, P.A.: SAE Handbook. Society of Automotive Engineers, Warrendale P.A.: Metals Handbook. American Society for Metals. Materials Park. Ohio, USA., 2001.

XIAOFEI, W.; YINGCHUN, S.H.; XIANDONG, L.; WANG, H.; JIEGONG, W.: “Simulation of biaxial wheel test and fatigue life estimation considering the influence of tire and wheel camber”, Advances in Engineering Software, 92: 57-64, 2016, ISSN: 0965-9978, DOI: https://doi.org/10.1016/j.advengsoft.2015.11.005.

ZHANBIAO, L.; DI CECCO, S.; ALTENHOF, W.; THOMAS, M.; BANTING, R.; HU, H.: “Stress and fatigue life analyses of a five-piece rim and the proposed optimization with a two-piece rim”, Journal of Terramechanics, 52: 31-45, 2014, ISSN: 0022-4898, DOI: https://doi.org/10.1016/j.jterra.2014.02.002.

ZHAO, Y.Q.; ZANG, L.G..; CHEN, Y.Q.; LI, B.; WANG, J.: “Non-pneumatic mechanical elastic wheel natural dynamic characteristics and influencing factors”, Journal of Central South University, 22(5): 1707-1715, 2015, ISSN: 1005-9784, DOI: https://doi.org/10.1007/s11771-015-2689-1.


Raudel Flores Moreno, Applicanttodoctorate, Universidad Autónoma Chapingo (UACH), Programa de Ingeniería Agrícola y Uso Integral del Agua, Departamento de Ingeniería Mecánica Agrícola (DIMA, km 38.5 carr. México - Texcoco. CP 56230, Chapingo, Estado de México, México, e-mail: raudelfm2014@hotmail.com

Gilberto de Jesús López Canteñs, Docente, Universidad Autónoma Chapingo (UACH), Programa de Ingeniería Agrícola y Uso Integral del Agua, Departamento de Ingeniería Mecánica Agrícola (DIMA, km 38.5 carr. México - Texcoco. CP 56230, Chapingo, Estado de México, México, e-mail: alelopez10@hotmail.com

Arturo Martínez Rodríguez, Profesor e Investigador Titular, Universidad Agraria de La Habana (UNAH), Centro de Mecanización Agropecuaria (CEMA), San José de las Lajas, Mayabeque, Cuba, C.P: 32700, e-mail: arturo@unah.edu.cu

Eugenio RomantchikKriuchkova, Docente, Universidad Autónoma Chapingo (UACH), Programa de Ingeniería Agrícola y Uso Integral del Agua, Departamento de Ingeniería Mecánica Agrícola (DIMA, km 38.5 carr. México - Texcoco. CP 56230, Chapingo, Estado de México, México, e-mail: eugenio.romantchik@gmail.com

Geisy Hernández Cuello, Investigadora Auxiliar, Universidad Agraria de La Habana (UNAH), Centro de Mecanización Agropecuaria (CEMA), San José de las Lajas, Mayabeque, Cuba, C.P: 32700, e-mail: geisyh@unah.edu.cu

The authors of this work declare no conflict of interest.

This article is under license Creative Commons Attribution-NonCommercial 4.0 International (CC BY-NC 4.0)

The mention of commercial equipment marks, instruments or specific materials obeys identification purposes, there is not any promotional commitment related to them, neither for the authors nor for the editor.


ARTÍCULO ORIGINAL


Evaluación de métodos para el cálculo de coeficientes de cargas dinámicas


RESUMEN

En las máquinas agrícolas, por lo general actúan fuerzas dinámicas, en particular cargas de impacto, lo que provoca roturas o fallas frecuentes. Esto se debe al carácter impulsivo de estos tipos de cargas, las cuales presentan corta duración en el tiempo, disminuyendo la capacidad de las estructuras y piezas para absorber la energía de deformación. Los métodos de cálculo que permiten obtener los coeficientes de cargas dinámicas, requieren operaciones complejas. En la presente investigación se evalúan y comparan tres metodologías para la obtención de coeficientes de cargas dinámicas: el método analítico tradicional, la simulación numérica basada en el análisis por elementos finitos y el método experimental. Tomando los resultados obtenidos experimentalmente como base comparativa, se obtuvo que los coeficientes de cargas dinámicas obtenidos por el método analítico alcanzaron diferencias relativas al método experimental del orden de 21.82 y 27.20 %, mientras que los resultados obtenidos empleando el método de los elementos finitos alcanzaron una diferencia relativa mucho menor, la cual osciló entre 3.48 y 5.11%, demostrando este método una alta aproximación a la determinación experimental.

Palabras clave: 

Elementos finitos; esfuerzos dinámicos; Cargas de impacto; condiciones de frontera.


INTRODUCCIÓN

Poder contar con cálculos precisos ycientíficamente justificados de coeficientes de cargas dinámicas garantiza diseños eficientes y un ahorro considerable de materiales en la fabricación de prototipos.

La determinación de los esfuerzos originados por las cargas dinámicas resulta compleja, dependiendo de factores tales como la zona de contacto en el impacto y el proceso de variación, en función del tiempo, de las fuerzas de contacto. En este sentido, la mayoría de los casos dinámicos se tratan de cuantificar en forma experimental y para que los cálculos resulten sencillos se utilizan cargas estáticas equivalentes. La determinación de los coeficientes de cargas dinámicas en estructuras sometidas a acciones de impacto, empleando métodos analíticos, representan un reto por su alta complejidad.

El método de los elementos finitos, como método numérico de discretización asistido por computadora, constituye una vía alternativa al método analítico de análisis del medio continuo, que facilita la solución de problemas complejos de ingeniería, siendo considerado una herramienta de indudable valor práctico y de gran aplicación a nivel mundial. Existen resultados importantes derivados del empleo de este método, entre los cuales se encuentran: Martínez et al.(2007); Liu et al.(2013); Untaroiu et al.(2013); Vavalle et al.(2013); Feng y Aymerich(2014); Nadal et al.(2014); Zhanbiao et al.(2014); Singh y Singh(2015); Zhao et al.(2015); Kong et al.(2016); Xiaofei et al.(2016); Castro y Güiza(2017).

El presente trabajo tiene como objetivo evaluar y comparar tres metodologías de determinación de coeficientes de cargas dinámicas: el método analítico tradicional (MA), la simulación numérica basada en el análisis por elementos finitos (MEF) y el método experimental (Mexp), tomándose este último como patrón de comparación y validación de los métodos teóricos.

MÉTODOS

Se empleó un diseño tipo multifactorial, utilizando 2 factores como variables independientes que corresponden a la altura y la carga de impacto, con diez y tres niveles, respectivamente. Los niveles de cargas fueron 25; 400 y 800 N y para laaltura de impacto desde 0 hasta 1 m con intervalos de 0.1 m.

Para los tres métodos analizados, el coeficiente de cargas dinámicas se determinó partiendo de la determinación de la deflexión estática producida sobre un sistema mecánico tomado como objeto de estudio bajo la acción de cargas estáticas con una magnitud igual al peso de un cuerpo que impacta a una determinada altura. Una vez determinadas las deflexiones estáticas máximas del sistema objeto de estudio, el coeficiente de cargas dinámicas se determinó empleando la expresión segúnPisarenko y Yakovlev (1979):

donde:

kd

- Coeficiente de cargas dinámicas ;

δest

- deflexión o flecha estática máxima, que depende también del esquema de solicitación y las condiciones de apoyo;

H

- altura de caída del cuerpo que impacta sobre el sistema objeto de estudio.

En este trabajo, la deflexión estática del sistema objeto de estudio fue determinada por los tres métodos mencionados: el método analítico tradicional de la mecánica de materiales; el método de los elementos finitos y el método experimental.

Descripción del sistema mecánico objeto de estudio

Como objeto de estudio se empleó una viga de sección transversal cuadrada(Tabla 1) en posición horizontal y apoyada en sus extremos con una articulación y un simple apoyo, como se muestra en la Figura 1.En el centro de la viga se aplicaban tres niveles de cargaQ (25, 400y 800 N) con vistas a provocar diferentes niveles de deflexiones estáticas(δ).En la Tabla 2 se muestran las propiedades mecánicas del material.

TABLA 1. 

Descripción del sistema en estudio

Sección transversalLado, mmMasa, kgMomento de inercia, m4Longitud, mmCarga que actúa, N
cuadrada39.09121.95*10-71000De 25 a 800 a intervalo de 25

2071-0054-rcta-28-04-e03-gf21.jpg

FIGURA 1. 

Esquema descriptivo del sistema objeto de estudio.

TABLA 2. 

Propiedades físico mecánicas del material de la viga

DescripciónValor
Módulo de elasticidad200 000 MPa
Coeficiente de poisson0.29
Densidad de masa7900 kgm-3
Limite a tracción420.507 MPa
Limite elástico351.561 MPa

Aplicación del Método de los Elementos Finitos (MEF)

La calidad del análisis por elementos finitos se garantizó efectuando un estudio de convergencia para definir el tamaño de elemento apropiado. La Figura 2,muestra la gráfica de deflexión contra tamaño de elemento apreciándose la estabilidad de los resultados a partir de un tamaño de elemento de 22.5 mm, siendo mucho más estable en 20 mm, por lo que este último fue el valor establecido para generar el mallado.

2071-0054-rcta-28-04-e03-gf22.jpg

FIGURA 2. 

Análisis de convergencia para determinar las características de la malla.

A partir del tamaño de elemento se establecen el resto de las propiedades de la malla (Tabla 3). En la Figura 3, se representa una vista en 3D del modelo de la viga con el mallado resultante y las condiciones de frontera, donde se aprecia las restricciones (flechas de color verde) y la carga aplicada estáticamente (flechas de color rojo).

TABLA 3. 

Caracteristicas de la malla empleada en el análisis

ParámetrosMallaCalidadToleranciaCant. de nodosCant. de elementosTamaño de elementos
DescripciónSólido, EstándarAlta0.05 mm4,3402,34220 mm

2071-0054-rcta-28-04-e03-gf23.jpg

FIGURA 3. 

Modelo 3D de la viga con la representación de las condiciones de frontera.

Descripción del método experimental empleado

La determinación experimental de las deformaciones estáticas que permitían determinar los coeficientes de cargas dinámicas del sistema objeto de estudio bajo diferentes cargas dinámicas se efectuó mediante técnicas de extensometría eléctrica.

En la cara inferior del centro de la viga objeto de estudio se colocaron galgasextensométricas(Figura 4) configuradas en un cuarto de puente deWheatstone, con el objetivo de obtener señales de voltaje proporcionales a la deformación unitaria (considerando las deformaciones dentro del límite elástico del material), producidas por cargas estáticas de diferente magnitud.Las cargas estáticas se obtenían colocando pesos de 25 N; 400 N y 800 N en el centro de la viga y registrando el voltaje de salida (eest) del sistema de medición. De forma similar se registraba el voltaje de salida (edin) producido por las mismas cargas aplicadas dejando caer al centro de la viga los mismos pesos desde diferentes alturas, entre 0.1 y 1 m. Para cada uno de los tratamientos se efectuaron tres repeticiones. El cociente de los voltajes obtenidos, para cada una de las cargas y alturas aplicadas, permitía obtener el coeficiente de cargas dinámicas en cada caso, aplicando la expresión:

donde:

e est

- es el voltaje registrado bajo la acción de las cargas aplicadas en forma estática;

e din

- es el voltaje máximo bajo la acción de las cargas aplicadas en forma dinámica (al dejar caer los pesos desde diferentes alturas);

ε est y ε din

- son las deformaciones unitarias correspondientes a las cargas estáticas y dinámicas, respectivamente;

δ est y δ din

- son esfuerzos normales correspondientes a las cargas estáticas y dinámicas, respectivamente.

2071-0054-rcta-28-04-e03-gf24.jpg

FIGURA 4. 

Galgas extensométricas pegadas en la cara inferior de la viga.

Las señales provenientes de las galgas extensométricas (del orden de los mV), eranprocesadasen un amplificador dinámico, modelo KYOWA-YA-520 con módulos de amplificación del tipo DPM-602B, siendo amplificadas hasta niveles de voltaje entre ± 5V.

La señal analógica proveniente del amplificador (Figura 5) era digitalizada en un convertidor análogo-digitalmodelo NATIONAL INSTRUMENTS - NI USB-4431e introducida a razón de 100 muestras por segundo en una computadoraportátil para su posterior procesamiento estadístico.

2071-0054-rcta-28-04-e03-gf25.jpg

FIGURA 5. 

Esquema de la instrumentación empleada durante el registro de las señales proporcionales a la deformación de la viga.

RESULTADOS YDISCUSIÓN

La Figura 6 muestra una de las salidas del análisis estático mediante el MEF para determinar la deformación unitaria de la viga objeto de estudio. Cuando la viga es sometida a 800 N de carga estática, se observa que el valor de la deformación unitaria es de 86.976 µstrain, mientras que el resultado del esfuerzo para ese mismo valor de carga se aprecia en la Figura 7, donde alcanzó un valor de 17.3952 MPa.

2071-0054-rcta-28-04-e03-gf26.jpg

FIGURA 6. 

Deformaciones en el centro de la viga bajo la acción de una carga estática de 800 N.

2071-0054-rcta-28-04-e03-gf27.jpg

FIGURA 7. 

Esfuerzo en el centro de la viga bajo la acción deuna carga estática de 800 N.

La Figura 8 muestra la deflexión estática de la viga en la dirección del eje Y, donde la deflexión máxima de la viga coincide con la flecha estática y este valor es tomado directamente de la escala, siendo igual a 0.2054 mm.

2071-0054-rcta-28-04-e03-gf28.jpg

FIGURA 8. 

Deflexión de la viga en la dirección vertical para una carga estática de 800 N mediante análisis por el método de los elementos finitos.

Evaluación experimental de la simulación numérica

LaFigura 9muestra dos gráficascon la distribución acumulada de las deformaciones predichas por el modelo analizado mediante el MEF y los resultados experimentales. Los datos obtenidosarrojaron que la distancia máxima entre las distribuciones acumuladas de las dos muestras es de 0.03125 µstrain, donde el p-valor aproximado obtenido es mayor a 0.05, por lo que no existe diferencia estadísticamente significativa entre las dos distribuciones para un nivel de confianza del 95 %. Se observóque los datos obtenidos para los esfuerzos predichos por el modelo analizado mediante MEF y los calculados a partir de pruebas experimentalescoinciden con los resultados obtenidos para la deformación, esto se debe a que los esfuerzos están calculados a partir de las deformaciones usando la ley de Hooke.

2071-0054-rcta-28-04-e03-gf29.jpg

FIGURA 9. 

Distribución acumulada (A) y función de distribución (B) entre las deformaciones predichas por la simulación y las obtenidas experimentales.

En la Figura 10 se observa el gráfico de distribución acumulada para comparar las deflexionespredichas por el modelo analizado mediante MEF y los resultados experimentales, donde se aprecia que las distancias máximas entre las distribuciones acumuladas de las dos muestras son de 0.09375 mm. Para el comportamiento de los valores de deflexión predicha y experimental se obtuvo un p-valor aproximado de 0.998965, como es mayor que 0.05, no existe diferencia estadísticamente significativa entre las dos distribuciones para un nivel de confianza del 95 %.

2071-0054-rcta-28-04-e03-gf30.jpg

FIGURA 10. 

Distribución acumulada (A) y función de distribución (B) entre las deflexiones predichas por la simulación y las obtenidas experimentales.

Resultado de los coeficientes de cargas dinámicas por los tres métodos estudiados

En la Tabla 4, se muestran los resultados de la determinación de los coeficientes de cargas dinámicas por los diferentes métodos estudiados y la diferencia relativa existente entre los métodos y los resultados experimentales. Se aprecia que la diferencia relativa del MEF oscila entre 3.479 y 5.112 %, siendo sustancialmente inferiores a los valores obtenidos para el método analítico (MA) que van desde 21.820 hasta 27.201 %.

Los coeficientes de carga dinámica alcanzaron valores de 391.203 para el caso analítico (MA), de 501.001 para el caso experimental y un valor de 528.047 para cuando se calculan los coeficientes de cargas dinámicas a partir de los datos obtenidos de la simulación numérica por el método de los elementos finitos (MEF), con una carga de 25 N. Los mayores valores de los coeficientes de cargas dinámicas en los tres métodos de cálculo se registraron para la mayor altura estudiada (1 m) y con la menor de las cargas aplicadas (25 N). Para una misma altura de impacto se determinó que los valores más altos de coeficientes de cargas dinámicas se registran para las cargas de impacto de menor masa (25 N). A una misma altura de impacto se obtienen los coeficientes de cargas dinámicas más bajos mientras mayor es la carga que impacta.El caso de que los mayores valores de coeficiente de cargas dinámicas se registren para la menor carga se debe a que el aumento de la masa del elemento que golpea provoca mayores deflexiones por lo que disminuye el coeficiente de cargas dinámicas, debido a su relación inversamente proporcional.

TABLA 4. 

Diferencias relativas de los coeficientes de cargas dinámicas por ambos métodos

Altura deimpacto; mCargaqueimpacta; NCoeficientes de cargasdinámicas Diferencia relativa
(MA)(M Exp.)(MEF)MA-MExp; %MEF- MExp; %
0.125124.397159.117167.6221.8205.344
40031.86442.89745.14125.7205.231
8002331.09932.2226.0433.605
0.225175.51224.61236.70421.8605.384
40044.63760.24363.41725.9055.269
8003243.55545.14126.5303.641
0.325214.725274.863289.67721.8795.390
40054.4473.55577.44125.9875.283
80038.79453.11555.05726.9623.656
0.425247.787317.229334.33521.8905.392
40062.70484.77789.26526.0375.294
80044.63761.17463.41727.0333.667
0.525276.916354.555373.67921.8985.394
40069.98694.66499.68226.0695.301
80049.78568.27570.78227.0823.672
0.625303.251388.3409.2521.9035.395
40076.569103.603109.126.0945.306
80054.4474.69477.44127.1163.678
0.725327.468419.331441.9621.9075.396
40082.623111.823117.7626.1135.309
80058.7280.59883.56527.1453.681
0.825350.009448.215472.40621.9105.397
40088.258119.474125.82126.1285.312
80062.70486.09389.26527.1673.684
0.925371.468475.343501.00121.8535.398
40093.55126.66133.39326.1415.316
80066.44691.25494.61827.1863.686
125391.203501.001528.04721.9165.398
40098.556133.457140.55426.1515.318
80069.98696.13699.68227.2013.689

En la Figura 11 se representa el comportamiento de los coeficientes de cargas dinámicas por los tres métodos estudiados para una carga de impacto de 400 N, el rango de alturas de impacto va desde 0.2 hasta 1 m. Se observa que la curva de comportamiento obtenida mediante el MEF es la que más se acerca a la obtenida por MExp.Los resultados obtenidos mediante la simulación numérica (MEF), brindaron mejores resultados y esto se debe a la ventaja que brinda el método de los elementos finitos ante los métodos analíticos, permitiendo simular el sistema de forma más realista, teniendo en cuenta un mayor número de factores durante la simulación. Los procesos analíticos son simplificados y no dejan de ser de mucho valor práctico para el diseño de innumerables sistemas, pero tienen el inconveniente de no permitir conocer a detalle el comportamiento estructural bajo acciones reales.

Coincidiendo con los resultados obtenidos, Aparicio y Casas(1987)señalan que en la interpretación de los resultados de pruebas de cargas de impacto, es importante conocer aspectos que no se consideran en los estudios analíticos, además resulta vitalconocer los detallesdel fenómeno cuando se tienen en cuenta la deflexión de estructuras de automóviles para ver su repercusión en el confort y la seguridad de los pasajeros(Álvarez et al., 1983). Por su parteBeltrán y Cerrolaza(1989), plantean que se hace necesario recurrir a modelos de cálculo más sofisticados que permitan reproducir con más fidelidad el comportamiento real de diferentes sistemas.

2071-0054-rcta-28-04-e03-gf31.jpg

FIGURA 11. 

Comportamiento de los coeficientes de cargas dinámicas para una carga de 400 N.

CONCLUSIONES

  • La simulación numérica comparada con datos experimentales para las deformaciones y los esfuerzos alcanzó un p-valor mayor a 0.05, por lo que no existe diferencia estadísticamente significativa entre las dos distribuciones para un nivel de confianza del 95 %.

  • Para las deflexiones predichas por el modelo analizado mediante MEF y los resultados experimentales se alcanzó un p-valor aproximado de 0.99, por lo que no existe diferencia estadísticamente significativa entre las dos distribuciones.

  • La diferencia relativa existente entre los coeficientes de cargas dinámicas por método experimental (MExp.) y por simulación numérica(MEF) oscila entre 3.479 y 5.122%, siendo sustancialmente inferiores a los valores obtenidos para el método analítico (MA), que alcanzó valores desde 21.820 hasta 27.201%.