ORIGINAL ARTICLE

http://opn.to/a/mrFJ9
Efficiency Criteria to Evaluate Sprinkler Irrigation
Dr.C. Maiquel López-Silva [I] [*]
Dr.C. Dayma Carmenates-Hernández [I]
Dr.C. Albi Mujica-Cervantes [I]
Dr.C. Pedro Paneque-Rondon [II]
[I] Universidad
de Ciego de Ávila Máximo Gómez Baez, Facultad de Ciencias Técnicas,
Centro de Estudios Hidrotécnicos, Ciego de Ávila, Cuba.
[II] Universidad Agraria de La Habana, Facultad de Ciencias Técnicas, San José de las Lajas, Mayabeque, Cuba.
[*] Author for correspondence: Maiquel López Silva, e-mail: maiquelcuba@yahoo.com
ABSTRACT
In
this work, different efficiency criteria were proposed for the
evaluation of sprinkler irrigation. The investigation was carried out at
six central pivots of the company Cubasoy and La Cuba. The methodology
used relates the climatic, hydraulic and energy variables by means of
the consumption of the specific energy standardized in the irrigation,
in such a way that allows characterizing the systems at project and
operation level. It was determined that the specific energy to pump a
cubic meter of water ranged between 0.18 kWh·m-3 to 0.32 kWh·m-3 and the specific energy normalized in irrigation between 17.16 to 30.53 kWh·mm-1·ha-1 100-1·m-1
for application efficiencies of 77.30 to 82.80%. Energy efficiency
actually used in irrigation reached from 8.92 to 15.80% under specific
operating conditions of the system of irrigation.
Keywords:
indicators; water; energy; central pivot.
Increasing the efficiency of water and energy use in agriculture is of vital importance in the face of climate change Selim et al. (2018),
so it is necessary to generate adaptation actions that allow adjusting
planning, operation and evaluation processes of irrigation service Ojeda et al. (2012). In this context, different efficiency indicators have been proposed (De Lima et al., 2008, Rodríguez et al., 2011, Schons et al., 2012, Bolognesi et al., 2014 and Won et al., 2016),
fundamental factors to help in the decision-making process regarding
improvements in the water distribution system, in order to optimize
energy and economic consumption (Tarjuelo et al., 2015).
There
are multiple indicators of water efficiency; the most common are
irrigation efficiency and water use efficiency. Low efficiency in
irrigation systems affects agricultural yields (Camejo et al., 2017 and Zhuo and Hoekstra, 2017).
The efficiency of the sprinkler irrigation system can be evaluated by
the Uniformity Coefficient of Heerman and Hein and by the Efficiency of
Application, while the specific energy in these systems is evaluated
through specific power or consumption indicators (De Almeida et al., 2017). For example, in Brazil, they can be characterized in terms of their specific consumption between 0,2 to 0,6 kWh m3 (De Lima et al., 2008). However, they are not sufficient to characterize the overall efficiency of an irrigation system (López et al., 2017).In
this sense, the objective of this work is to analyze the efficiency
criteria for the evaluation of projects and operation of sprinkler
irrigation in the agricultural companies Cubasoy and La Cuba of various
crops, in the province of Ciego de Ávila.
The
research was carried out in the enterprises Cubasoy and La Cuba in the
hydrogeological sector south CA-II-1 and north CA-I-8, while their
average water levels behave in 9.66 m and 17.53 m, respectively,
according to the historical series of 30 years (1985 to 2015). Table 1 shows the characteristics of the central pivot irrigation system that were analyzed.
Table 1.
Characteristics of the pressure irrigation system
| Zone | Pivot | Sprinkler | Area (ha) | Topographic slope (m) | Suction pipe* | Drive pipe * | Side pipe ** |
|---|
| DN (mm) | L (m) | DN (mm) | L (m) | DN (mm) | L (m) |
|---|
| Cuba soy | 2415 | Rotator | 63,86 | 18,0 | 203,2 | 17,50 | 203,20 | 8,0 | 168,30 | 451 |
| 3120 | Rotator | 58,87 | 16,9 | 203,20 | 20,0 | 203,20 | 12,0 | 168,30 | 433 |
| 3116 | Rotator | 57,25 | 17,7 | 203,20 | 18,30 | 203,20 | 10,0 | 168,30 | 427 |
| La Cuba | Lango | Spray | 62,30 | 9,1 | 203,20 | 7,65 | 203,20 | 12,0 | 168,30 | 445 |
| Higinio | Spray | 62,50 | 9,0 | 203,20 | 8,0 | 203,20 | 31,0 | 168,30 | 446 |
| Frutero | Spray | 41,00 | 10,1 | 203,20 | 9,30 | 203,20 | 6,50 | 168,30 | 362 |
* galvanized iron; ** galvanized steel; DN nominal diameter; L length of the pipe
The
criterion of efficiency in the irrigation systems begins in determining
the minimum work to pump the water used by the crop. From the physical
criteria, the useful power for the irrigation system can be obtained
from the water level in the well and the most unfavorable point of the
irrigation area (Equation 1). While, the
powers dissipated in each of the element of the irrigation system
(suction, pump-motor, drive, sprinkler) depending on the efficiency of
application for 80% of the area properly irrigated, can be expressed by
the expressions (2; 3 and 4).
Where:
- useful power of the irrigation system (kW)
- power dissipated in the motor pump set (kW)
- power dissipated in the element (kW)
- power dissipated in the sprinklers (kW)
- manometric height of the pump (m)
-
topographic difference between the water level in the well and the
sprinkler in the most unfavorable condition of the system (m)
- flow measured at the pump outlet (m³ s-1)
- specific weight of water (9.806 kN m-³)
- efficiency of water application (%)
- the loss of load in the elements of the system (m), being the pipes and accessories
- manometric height of the sprinkler (m)
- performance of the pump-motor assembly (decimal)
The
power dissipated in the irrigation system according to the efficiency
of application for 80% of the adequately irrigated area, the geometric
slope and the load losses of the elements of the system are represented
by the following equation:
Where P
dsr
is the power dissipated in the irrigation system (kW); ∆h
s
the loss of load in the suction (m), ∆h
i
the pressure drop in the discharge pipe (m) and Δhasp the head loss in the sprinkler (m);
Criteria of Efficiency of the Irrigation System
The
efficiency criteria were based on the specific consumption of energy of
the irrigation system in accordance with the following equations:
Where:
- standardized energy consumption of the pump-motor assembly (kWh m-3 100-1 m-1)
- specific energy consumption (kWh m-3)
- consumption of useful energy (kWh ha-1)
- specific consumption in the sprinklers (kWh mm-1 ha-1)
- consumption of the specific energy normalized in the irrigation (kWh mm-1 ha-1 100-1 m-1)
- percentage of energy actually used (%)
- time it takes for the lateral to apply a watering (h)
- irrigation area of the central pivot (ha)
The
flow rate and liquid velocity in the impulse pipe was determined by
means of a PCE-TDS-100 ultrasonic meter with an accuracy of ± 1.5%. The
power in the electric motor was obtained from a MI 2392 Power Q Plus
grid analyzer with an accuracy of ± (1% + 0.5 V), ± (2% + 0.3 A), ± (3% +
3 Wh), ± 0.06 Cosine φ and ± (0.5% + 0.02 Hz). The pressure reading was
taken at the pivot, at the towers and at the end of the side by the
high precision digital manometer Type CPG1500 brand WIKA with an
accuracy of 0.05%. Climatic variables were measured from the AVM-40
Mobile Climatic Anemometer (Kestrel 4000) with an accuracy of ± 3% in
wind speed, ± 1 ° C in temperature and ± 3% relative humidity of air.
Table 2 shows the results of the
variables measured in the irrigation systems. It is observed that the
flows in the irrigation systems range between 60,10 to 76,67 L/s.
However, the manometric heights of the centrifugal pumps were superior
in the Cubasoy Company and it, consequently, reached an average
electrical consumption of 69%. The prevailing wind speeds in the central
pivots are classified as low winds according to Tarjuelo (2005),
which favorably influences an application efficiency for 80% of the
adequately irrigated area from 77,30% to 82,80%; values higher than
those reached by Román et al. (2013) and similar to those obtained by Palacios et al. (2017).
Table 2.
Measures of hydraulic, energy and climate variables
| Zone | Pivot | Hidr (L s-1 ha-1) | H
b
(m) | T
R
(h) | Pe (kW) | EA80% | Weather conditions |
|---|
| T (ºC) | HR (%) | V (m s-1) |
|---|
| Cubasoy | 2415 | 1,20 | 83,02 | 47 | 70,30 | 82,80 | 31,20 | 70,30 | 2,0 |
| 3120 | 1,23 | 86,17 | 35 | 72,0 | 80,0 | 32,40 | 63,60 | 2,77 |
| 3116 | 1,21 | 88,52 | 56 | 80 | 81,02 | 33,0 | 75,40 | 2,30 |
| La Cuba | Lango | 0,96 | 55,41 | 56 | 40,48 | 81,40 | 29,30 | 79,15 | 1,60 |
| Higinio | 1,15 | 69,92 | 68 | 69,87 | 77,30 | 30,0 | 69,50 | 2,20 |
| Frutero | 1,62 | 54,43 | 50 | 44,22 | 80,88 | 26,0 | 80,0 | 1,30 |
Hidr is the hydromodule; EA
80%
the application efficiency for 80% of the area adequately irrigated;
T the temperature; HR the relative humidity of the air and V the wind
speed.
Table 3 shows the results of the power
dissipated by each of the components of the irrigation system. It is
appreciated that the highest energy consumption in the pumping station
3116 is 19,71 kW and a power dissipated in the irrigation system of
33,03 kW, this registered the lowest efficiency of the pump set of
62,78% product to the operation time. However, the rest of the
efficiencies of the motor pump set in the other irrigation systems
ranged from 69,5 to 74,10% classified as excellent according to Abadia et al. (2008).
The favorable results were in Lango pumping station with dissipated
power of 4,37 kW and a power dissipated in the irrigation system of
17,24 kW.
Table 3.
Power dissipated by component
| Parameters | Cubasoy | La Cuba |
|---|
| 2415 | 3120 | 3116 | Lango | Higinio | Frutero |
|---|
| P
usr
(kW) | 11,16 | 9,61 | 9,77 | 4,37 | 5,34 | 5,32 |
| P
dbm
(kW) | 7,82 | 10,74 | 19,71 | 7,82 | 10,64 | 8,78 |
| P
de
(kW) | 10,98 | 9,48 | 11,11 | 7,05 | 10,68 | 7,73 |
| P
dasp
(kW) | 8,14 | 7,56 | 7,71 | 4,92 | 8,24 | 5,49 |
| P
dsr
(kW) | 28,21 | 28,73 | 33,03 | 17,24 | 28,46 | 19,63 |
Figure 1 shows the percentages of the
power dissipated in each element of the irrigation system. It is
confirmed that the component with the highest power consumption is the
pump-motor assembly and the 3116 consumes 40,78% of its electrical
energy to convert it into energy, while the pumping station 3120 only
uses 28,68%. These obtained values are close to those reached by De Lima et al. (2008). In Figure 1,
in the laterals of the central pivots, the dissipated powers oscillate
from 24,20% to 29,59% with lengths of 309 m to 451 m. The pivot 3116,
equipped with the Rotator sprinkler, achieved a lower dissipated power
of 15,96%, which is higher than those obtained by De Lima et al. (2008),
parameter that is attributed to the years of the irrigation system in
operation without receiving adequate maintenance. However, the useful
powers of the central pivots of Cubasoy Company were superior to those
of the Cuba, because it uses the highest hydraulic variables, flow and
pump gauge height and, consequently, electrical power.
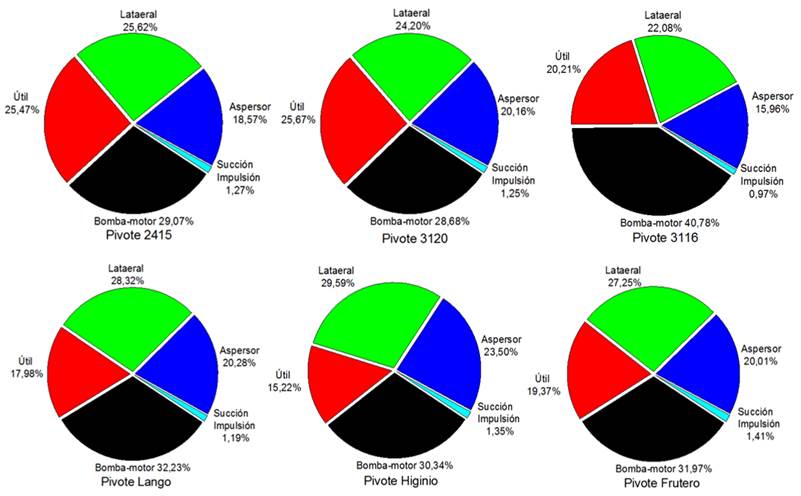
Figure 1.
Stratification of the power dissipated in irrigation systems.
The stratification of the power dissipated in
each component of the irrigation systems provides a view of the loss of
energy, but according to De Lima et al. (2008),
it is restricted because it is considered that all the water pumped is
harvested by the crop. Therefore, it is necessary to obtain indicators
expressed in terms of the efficiency of application.
Table 4 shows the results of the
hydraulic and energetic efficiency of the central pivot irrigation
system. The most favorable pivot to the consumption of useful energy was
that of Lango with 3,93 kWh ha-1 and the highest consumption
was in the pivot 3116 with 9,55 kWh ha-1 for 80% of the area adequately
irrigated at 81,40% and 81,02% of the application efficiency of the
irrigation system, respectively. However, the specific energy
consumption for pumping one cubic meter ranged from 0,18 kWh m-3 to 0.32 kWh m-3. These results are lower than those obtained by De Lima et al. (2008), Schons et al. (2012) and Brenon et al. (2018),
due to the study areas of these authors show topographic differences
greater than 20 m. However, the comparison of specific values of energy
consumption to refer to pumping stations must be made with caution
because of the different factors involved.
Table 4.
Efficiency of irrigation system
| Parameters | Cubasoy | La Cuba |
|---|
| | 2415 | 3120 | 3116 | Lango | Higinio | Frutero |
|---|
| CEN
BM
(kWh m
-3
100
-1
m
-1
) | 0.31 | 0.32 | 0.36 | 0.34 | 0.33 | 0.34 |
| CE
E
(kWh m
-3
) | 0.25 | 0.28 | 0.32 | 0.19 | 0.23 | 0.18 |
|
CEu
80
(kWh ha
-1
) | 8.21 | 5.71 | 9.55 | 3.93 | 5.81 | 6.46 |
|
CE
Asp
(kWh mm
-1
ha
-1
) | 0.36 | 44.96 | 81.80 | 39.72 | 69.13 | 58.14 |
The pivot with the best performance of the normalized energy consumption of the pump-motor assembly was the 2415 with 0,31 kWh m-3 100-1 m-1,
which means that the operating point of the irrigation system operates
with a stable efficiency over 80%. However, it was identified that the
selection of the pump-motor assembly for the pivot 3116 was not the most
suitable, because it has the highest consumption of 0.36 kWh m-3 100-1 m-1. However, the results obtained are lower than those determined by De Lima et al. (2008) and Schons et al. (2012).
Figure 2.
Specific energy consumption normalized in irrigation.
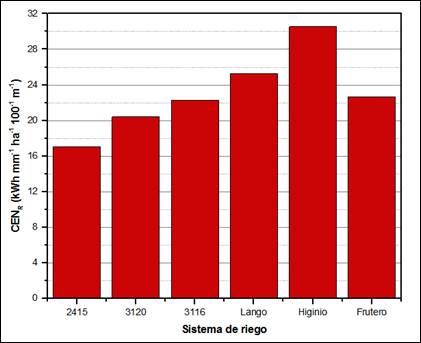
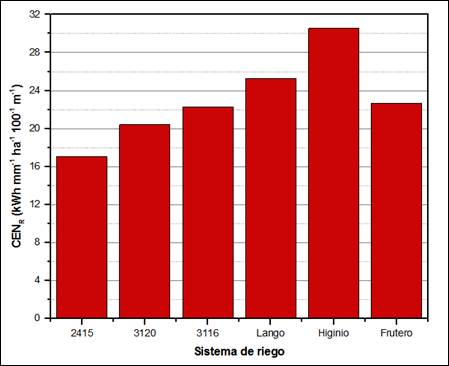
Figure 2 shows the specific energy
consumption normalized in irrigation. It is observed that the pivot 2415
obtains the lowest specific energy consumption normalized in the
irrigation of 17.16 kWh to provide one millimeter of water in 80% of the
adequately irrigated area, when the geometric height is less than 100
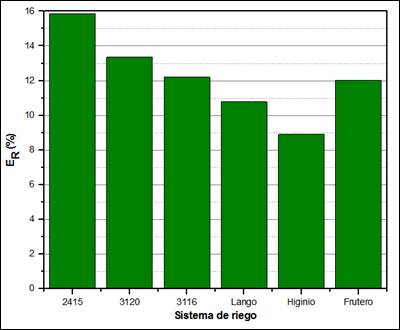
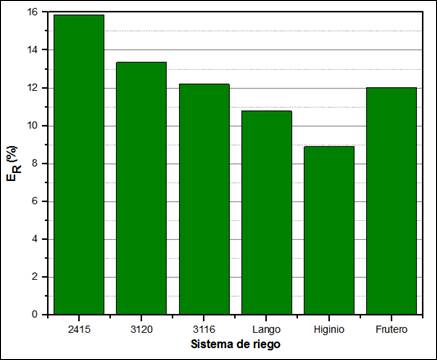
m. However, Figure 3 shows the percentage of
energy actually used and the 2415 system reaches 15.80% with a higher
percentage of energy actually used in irrigation. That means that the
pump-motor assembly, the pipes, the leakage, water losses, pressure
regulators, sprinklers and water losses due to evaporation and drag
dissipate 84.20% of the energy.
Figure 3.
Percentage of energy actually used.
In general, Figures 1 and 2
show that the central pivots of Cubasoy Company have lower specific
energy consumption and, in turn, greater energy actually used in
irrigation. This result is due to the sensitivity analysis performed to
the energy indicators that for each 1 kW of power measured in the
electric motor, the specific energy consumption normalized in irrigation
is 0,25 kWh mm-1 ha-1 100-1 m-1.
While, for every 1 m of topographic difference between the water level
in the well and the sprinkler in the most unfavorable condition of the
system, increases 0,88% the percentage of energy actually used. These
factors are also due to the characteristics of the curves of the
centrifugal pumps placed in the pressure irrigation systems.
The
stratification of the power dissipated in each component of the
irrigation system allowed identifying the pumping station with the
highest energy consumption for the immediate maintenance of its
elements. The central pivot 2415 reached the best performance of the
efficiency indicators with a normalized energy consumption of the
pump-motor set of 0,31 kWh m-3 100-1 m-1, a specific energy normalized in the irrigation of 17,16 kWh mm-1 ha-1 100-1 m-1 at an application efficiency of 82,80% for 15,80% of energy actually used in irrigation.
It
is reaffirmed that efficiency criteria contribute to the valorization
of efficient irrigation technologies for the project modality and in the
specific operation conditions for optimum crop productivity, based on a
sustainable use of natural resources; as well as it allows improving
the decision making for the previous maintenance.
Received: 23/11/2018
Accepted: 29/04/2019
Maiquel López Silva,
professor e investigador, Universidad de Ciego de Ávila Máximo Gómez
Baez, Facultad de Ciencias Técnicas, Centro de Estudios Hidrotécnicos,
Ciego de Ávila, Cuba, e-mail: maiquelcuba@yahoo.com
Dayma Carmenates Hernández,
professora e investigadora titular, Universidad de Ciego de Ávila
Máximo Gómez Baez, Facultad de Ciencias Técnicas, Centro de Estudios
Hidrotécnicos, Ciego de Ávila, Cuba, e-mail: daymas@unica.cu
Albi Mujica Cervantes,
professor e investigador titular, Universidad de Ciego de Ávila Máximo
Gómez Baez, Facultad de Ciencias Técnicas, Centro de Estudios
Hidrotécnicos, Ciego de Ávila, Cuba, e-mail: albi@unica.cu
Pedro Paneque Rondón,
Profesor e investigador titular, Universidad Agraria de La Habana,
Facultad de Ciencias Técnicas, San José de las Lajas, Mayabeque, Cuba,
e-mail: paneque@unah.edu.cu
The authors of this work declare no conflict of interest.
This article is under license Creative Commons Attribution-NonCommercial 4.0 International (CC BY-NC 4.0)
The
mention of commercial equipment marks, instruments or specific
materials obeys identification purposes, there is not any promotional
commitment related to them, neither for the authors nor for the editor.
ARTÍCULO ORIGINAL
Criterios de eficiencia para la evaluación del riego por aspersión
Dr.C. Maiquel López-Silva [I] [*]
Dr.C. Dayma Carmenates-Hernández [I]
Dr.C. Albi Mujica-Cervantes [I]
Dr.C. Pedro Paneque-Rondon [II]
[I] Universidad
de Ciego de Ávila Máximo Gómez Baez, Facultad de Ciencias Técnicas,
Centro de Estudios Hidrotécnicos, Ciego de Ávila, Cuba.
[II] Universidad Agraria de La Habana, Facultad de Ciencias Técnicas, San José de las Lajas, Mayabeque, Cuba.
[*] Autor para correspondencia: Maiquel López Silva, e-mail: maiquelcuba@yahoo.com
RESUMEN
En
este trabajo se plantearon diferentes criterios de eficiencia para la
evaluación del riego por aspersión. La investigación se realizó en 6
pivotes centrales de la empresa Cubasoy y La Cuba. La metodología
utilizada relaciona las variables climáticas, hidráulicas y energéticas
por medio del consumo de la energía específica normalizada en el riego,
de forma que permite caracterizar los sistemas a nivel de proyecto y de
explotación. Se determinó que la energía específica para bombear un
metro cubico de agua osciló entre 0,18 kWh·m-3 a 0,32 kWh·m-3 y la energía específica normalizada en el riego entre 17,16 a 30,53 kWh·mm-1·ha-1100-1·m-1
para unas eficiencias de aplicaciones de 77,30 a 82,80% y una
eficiencia de la energía realmente aprovechado en el riego de 8,92 a
15,80% en condiciones específicas de operación del sistema de riego.
Palabras clave:
indicadores; agua; energía; pivote central.
Incrementar la eficiencia del uso del agua y la energía en la agricultura es de vital importancia ante el cambio climático Selim et al. (2018),
por lo que es necesario generar acciones de adaptación que permitan
ajustar el proceso de planificación, operación y evaluación del servicio
del riego Ojeda et al. (2012). En este contexto se han propuesto diferentes indicadores de eficiencia De Lima et al. (2008); Rodríguez et al. (2011); Schons et al. (2012); Bolognesi et al. (2014); Won et al. (2016),
factores fundamentales para ayudar en el proceso de toma de decisiones
con respecto a las mejoras en el sistema de distribución de agua, a fin
de optimizar el consumo energético y económico Tarjuelo et al. (2015).
Existen
múltiples indicadores de eficiencia del agua, los más comunes son la
eficiencia del riego y la eficiencia del uso del agua. Una baja
eficiencia en los sistemas de riego afectan a los rendimientos agrícolas
Camejo et al. (2017); Zhuo y Hoekstra (2017).
La eficiencia del sistema de riego por aspersión puede ser evaluada por
el Coeficiente de Uniformidad de Heerman y Hein y por la Eficiencia de
Aplicación; mientras que, la energía específica en estos sistemas es a
través de indicadores de potencia o consumo específico De Almeida et al. (2017). Por ejemplo, en Brasil pueden ser caracterizados en cuanto a su consumo específico entre 0,2 a 0,6 kWh·m-3 (De Lima et al., 2008). Sin embargo, no son suficientes para caracterizar la eficiencia global de un sistema de riego (López et al., 2017).
En este sentido, el objetivo de este trabajo es analizar los criterios
de eficiencia para la evaluación de proyectos y operación del riego por
aspersión en la empresa agropecuaria Cubasoy y cultivos varios La Cuba
de la provincia de Ciego de Ávila.
La
investigación se desarrolló en la empresa Cubasoy y La Cuba dentro del
sector hidrogeológico sur CA-II-1 y norte CA-I-8, mientras que sus
niveles freáticos promedio se comportan en 9,66 m y 17,53 m
respectivamente, según la serie histórica de 30 años (1985 a 2015). En
la Tabla 1 se muestran las características del sistema de riego de pivote central que se analizaron.
TABLA 1.
Características del sistema de riego a presión
| Zona | Pivote | Aspersor | Área (ha) | Desnivel topográfico (m) | Tubería de succión* | Tubería de impulsión* | Tubería del lateral** |
|---|
| DN (mm) | L (m) | DN (mm) | L (m) | DN (mm) | L (m) |
|---|
| Cuba soy | 2415 | Rotator | 63,86 | 18,0 | 203,2 | 17,50 | 203,20 | 8,0 | 168,30 | 451 |
| 3120 | Rotator | 58,87 | 16,9 | 203,20 | 20,0 | 203,20 | 12,0 | 168,30 | 433 |
| 3116 | Rotator | 57,25 | 17,7 | 203,20 | 18,30 | 203,20 | 10,0 | 168,30 | 427 |
| La Cuba | Lango | Spray | 62,30 | 9,1 | 203,20 | 7,65 | 203,20 | 12,0 | 168,30 | 445 |
| Higinio | Spray | 62,50 | 9,0 | 203,20 | 8,0 | 203,20 | 31,0 | 168,30 | 446 |
| Frutero | Spray | 41,00 | 10,1 | 203,20 | 9,30 | 203,20 | 6,50 | 168,30 | 362 |
*de hierro galvanizado; ** acero galvanizado; DN el diámetro nominal; L la longitud de la tubería
El
criterio de eficiencia en los sistemas de riego inicia en determinar el
mínimo trabajo para bombear el agua utilizada por el cultivo. A partir
de los criterios físicos la potencia útil para el sistema de riego se
puede obtener a partir del nivel del agua en el pozo y el punto más
desfavorable del área de riego (ecuación 1).
Mientras que, las potencias disipadas en cada uno de los elementos del
sistema de riego (succión, bomba-motor, impulsión, aspersor) en función
de la eficiencia de aplicación para el 80% del área adecuadamente
regada, se puede expresar por las expresiones (2; 3 y 4).
donde:
- la potencia útil del sistema de riego (kW);
- la potencia disipada en el conjunto bomba motor (kW);
- la potencia disipada en el elemento (kW);
- la potencia disipada en los aspersores (kW);
- la altura manométrica de la bomba (m);
- el desnivel topográfico entre el nivel del agua en el pozo y el aspersor en la condición más desfavorable del sistema (m);
- el caudal medido a la salida de la bomba (m³·s-1);
- el peso específico del agua (9,806 kN·m-³);
- la eficiencia de aplicación del agua (%);
- la pérdida de carga en los elementos del sistema (m), siendo las tuberías y accesorios;
- altura manométrica del aspersor (m);
- es el rendimiento del conjunto bomba-motor (decimal).
La
potencia disipada en el sistema de riego en función de la eficiencia de
aplicación para el 80% del área adecuadamente regada, el desnivel
geométrico y las pérdidas de cargas de los elementos del sistema viene
representado por la siguiente ecuación:
Donde
- es la potencia disipada en el sistema de riego (kW);
- la pérdida de carga en la succión (m);
-la pérdida de carga en la tubería de impulsión (m);
- la pérdida de carga en el aspersor (m);
Criterios de eficiencia del sistema de riego
Los
criterios de eficiencia se basaron en el consumo específico de la
energía del sistema de riego conforme con las siguientes ecuaciones:
Donde:
- el consumo de energía normalizada del conjunto bomba-motor (kWh·m-3100-1·m-1);
- el consumo de la energía específica (kWh·m-3);
- el consumo de la energía útil (kWh·ha-1);
- el consumo específico en los aspersores (kWh·mm-1·ha-1);
- el consumo de la energía específica normalizada en el riego (kWh·mm-1·ha-1·100-1·m-1);
- el porcentaje de energía realmente aprovechado (%);
- el tiempo que demora el lateral en aplicar un riego (h);
- el área de riego del pivote central (ha).
Se
determinó el caudal y velocidad de líquido en la tubería de impulsión a
través del medidor ultrasónico PCE-TDS-100 con una precisión de ± 1,5%.
La potencia en el motor eléctrico se obtuvo a partir del analizador de
redes MI 2392 Power Q Plus con una precisión de ± (1% + 0,5 V), ±(2% +
0,3 A), ±(3% + 3 Wh), ±0,06 Coseno φ y ±(0,5% + 0,02 Hz). Se tomó la
lectura de presión en el pivote, en las torres y final del lateral
mediante el manómetro digital de alta precisión Tipo CPG1500 marca WIKA
con una precisión de 0,05%. Las variables climáticas se midieron a
partir del Anemómetro Climático móvil AVM-40 (Kestrel 4000) con
precisión de ±3% en la velocidad del viento, la temperatura ±1 °C y la
humedad relativa del aire ±3%.
En la Tabla 2
se muestran los resultados de las variables medidas en los sistemas de
riego. Se observa que los caudales en los sistemas de riego oscilan
entre 60,10 a 76,67 L/s. Sin embargo, las alturas manométricas de las
bombas centrífugas son superiores en la empresa Cubasoy y
consecuentemente alcanzó mayor consumo eléctrico promedio de 69%. Las
velocidades del viento predominante en los pivotes centrales se
clasifican como vientos bajos según Tarjuelo (2005),
lo que influye favorablemente en una eficiencia de aplicación para el
80% del área adecuadamente regada de 77,30% a 82,80%; valores superiores
a los alcanzados por Román et al. (2013) y similares a los obtenidos por Palacios et al. (2017).
TABLA 2.
Medidas de las variables hidráulicas, energéticas y climáticas
| Zona | Pivote | Hidr (L s-1·ha-1) | H
b
(m) | T
R
(h) | Pe (kW) | EA80% | Condiciones climáticas |
|---|
| T (ºC) | HR (%) | V (m·s-1) |
|---|
| Cubasoy | 2415 | 1,20 | 83,02 | 47 | 70,30 | 82,80 | 31,20 | 70,30 | 2,0 |
| 3120 | 1,23 | 86,17 | 35 | 72,0 | 80,0 | 32,40 | 63,60 | 2,77 |
| 3116 | 1,21 | 88,52 | 56 | 80 | 81,02 | 33,0 | 75,40 | 2,30 |
| La Cuba | Lango | 0,96 | 55,41 | 56 | 40,48 | 81,40 | 29,30 | 79,15 | 1,60 |
| Higinio | 1,15 | 69,92 | 68 | 69,87 | 77,30 | 30,0 | 69,50 | 2,20 |
| Frutero | 1,62 | 54,43 | 50 | 44,22 | 80,88 | 26,0 | 80,0 | 1,30 |
Hidr es el hidromódulo; EA
80%
la eficiencia de aplicación para el 80% del área adecuadamente
regada; T la temperatura; HR la humedad relativa del aire y V la
velocidad del viento.
En la Tabla 3 se
muestran los resultados de la potencia disipada por cada uno de los
componentes del sistema de riego. Se aprecia que el de mayor consumo
energético es la estación de bombeo 3116 es de 19,71 kW y una potencia
disipada en el sistema de riego de 33,03 kW, éste registró la menor
eficiencia del conjunto bomba motor de 62,78% producto al tiempo de
operación. No obstante, el resto de las eficiencias del conjunto bomba
motor de los demás sistemas de riego osciló de 69,5 a 74,10% clasificado
como excelente según Abadia et al. (2008).
Los resultados favorables fue la estación de bombeo de Lango con
potencia disipada de 4,37 kW y una potencia disipada en el sistema de
riego de 17,24 kW.
TABLA 3.
Potencia disipada por componente
| Parámetros | Cubasoy | La Cuba |
|---|
| 2415 | 3120 | 3116 | Lango | Higinio | Frutero |
|---|
| P
usr
(kW) | 11,16 | 9,61 | 9,77 | 4,37 | 5,34 | 5,32 |
| P
dbm
(kW) | 7,82 | 10,74 | 19,71 | 7,82 | 10,64 | 8,78 |
| P
de
(kW) | 10,98 | 9,48 | 11,11 | 7,05 | 10,68 | 7,73 |
| P
dasp
(kW) | 8,14 | 7,56 | 7,71 | 4,92 | 8,24 | 5,49 |
| P
dsr
(kW) | 28,21 | 28,73 | 33,03 | 17,24 | 28,46 | 19,63 |
En la Figura 1
se muestran los porcentajes de la potencia disipada en cada elemento del
sistema de riego. Se ratifica que el componente de mayor consumo de
potencia es el conjunto bomba-motor y el 3116 consume el 40,78% de su
energía eléctrica para convertirla en energía, mientras que, la estación
de bombeo 3120 solo emplea el 28,68%. Estos valores obtenidos son
próximos a los alcanzados por De Lima et al. (2008). En la Figura 1
los laterales de los pivotes centrales las potencias disipadas oscilan
de 24,20% a 29,59% con longitudes de 309 m a 451 m. El pivote 3116
dotado del aspersor Rotator alcanzó menor potencia disipada de 15,96%,
dicho valor es superior respecto a los obtenidos por De Lima et al. (2008),
parámetro que se le atribuye a los años del sistema de riego en
funcionamiento sin recibir el mantenimiento adecuado. Sin embargo, las
potencias útiles de los pivotes centrales de la empresa Cubasoy soy
superiores respecto a los de la Cuba, debido a que emplea las mayores
variables hidráulicas, caudal y altura manométrica de la bomba y
consecuentemente la potencia eléctrica.
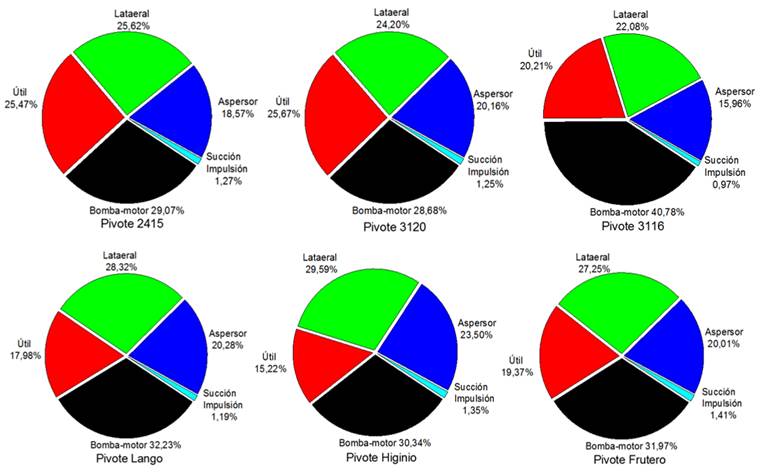
FIGURA 1.
Estratificación de la potencia disipada en los sistemas de riego.
La estratificación de la potencia disipada
en cada componente de los sistemas de riego proporciona una visión de la
pérdida de energía, pero de acuerdo con De Lima et al. (2008)
queda restringido porque considera que toda el agua bombeada es
aprovechada por el cultivo, por tanto, es necesario obtener indicadores
expresados en función de la eficiencia de aplicación.
En la Tabla 4
se exponen los resultados de la eficiencia hidráulica y energética del
sistema de riego de pivote central, el pivote más favorable al consumo
de energía útil fue el de Lango con 3,93 kWh·ha-1 y el de mayor consumo el pivote 3116 con 9,55 kWh·ha-1
para el 80% del área adecuadamente regada al 81,40% y 81,02% de la
eficiencia de aplicación del sistema de riego respectivamente. Sin
embargo, los consumos de energía específica para bombear un metro cubico
oscilaron entre 0,18 kWh·m-3 a 0,32 kWh·m-3. Esto resultados son inferiores con respecto a los obtenidos por De Lima et al. (2008); Schons et al. (2012); Brenon et al. (2018),
producto a que las áreas de estudios de estos autores presentan
desniveles topográficos superiores a los 20 m. No obstante, la
comparación de valores específicos de consumo de energía para referirse a
estaciones de bombeo debe hacerse con precaución por los diferentes
factores que intervienen.
TABLA 4.
Eficiencia del sistema de riego
| Parámetros | Cubasoy | La Cuba |
|---|
| | 2415 | 3120 | 3116 | Lango | Higinio | Frutero |
|---|
| CEN
BM
(kWh·m
-3
·100
-1
·m
-1
) | 0.31 | 0.32 | 0.36 | 0.34 | 0.33 | 0.34 |
| CE
E
(kWh·m
-3
) | 0.25 | 0.28 | 0.32 | 0.19 | 0.23 | 0.18 |
|
CEu
80
(kWh·ha
-1
) | 8.21 | 5.71 | 9.55 | 3.93 | 5.81 | 6.46 |
|
CE
Asp
(kWh·mm
-1
·ha
-1
) | 0.36 | 44.96 | 81.80 | 39.72 | 69.13 | 58.14 |
El pivote con mejor desempeño del consumo de energía normalizada del conjunto bomba-motor fue el 2415 con 0,31 kWh·m-3·100-1·m-1,
lo que significa que el punto de funcionamiento del sistema de riego
opera con una eficiencia estable superior al 80%. Sin embargo, se
identificó que la selección del conjunto bomba-motor para el pivote 3116
no fue el más adecuado, porque posee el mayor consumo de 0,36 kWh·m-3·100-1·m-1. No obstante, los resultados obtenidos son inferiores a los que determinó De Lima et al. (2008); Schons et al. (2012).
En la Figura 2
se muestra el consumo de energía específica normalizada en el riego. Se
observa que el pivote 2415 obtiene el menor consumo de energía
específica normalizada en el riego de 17,16 kWh para proporcionar un
milímetro de agua en el 80% del área adecuadamente regada, cuando la
altura geométrica es inferior de 100 m. Sin embargo, en la Figura 3
se muestra el porcentaje de energía realmente aprovechado y el sistema
2415 alcanza 15,80% con mayor porcentaje de energía realmente
aprovechado en el riego; lo que significa que el 84,20% de la energía es
disipada por el conjunto bomba-motor, las tuberías, las pérdidas de
agua por fuga, los reguladores de presión, aspersores y pérdidas de agua
por evaporación y arrastre.
FIGURA 2.
Consumo de energía específica normalizada en el riego.
Figura 3.
Porcentaje de energía realmente aprovechado.
De forma general en las Figuras 1 y 2
se observa que los pivotes centrales de la empresa de Cubasoy presentan
menor consumo de energía específica y a su vez mayor energía realmente
aprovechada en el riego. Este resultado se debe al análisis de
sensibilidad realizado a los indicadores energéticos se obtuvo que por
cada 1 kW de potencia medido en el motor eléctrico el consumo de energía
específica normalizada en el riego es de 0,25 kWh·mm-1·ha-1·00-1·m-1.
Mientras que, por cada 1 m de desnivel topográfico entre el nivel del
agua en el pozo y el aspersor en la condición más desfavorable del
sistema, aumenta 0,88% el porcentaje de energía realmente aprovechado.
Estos factores también se deben a las características de las curvas de
las bombas centrífugas colocadas en los sistemas de riego a presión.
La
estratificación de la potencia disipada en cada componente del sistema
de riego permitió identificar la estación de bombeo con mayor consumo de
energía para su inmediato mantenimiento de sus elementos.
El
pivote central 2415 alcanzó el mejor desempeño de los indicadores de
eficiencia con un consumo de energía normalizada del conjunto
bomba-motor de 0,31 kWh·m-3·100-1·m-1, una energía específica normalizada en el riego de 17,16 kWh·mm-1·ha-1·100-1·m-1 a una eficiencia de aplicación de 82,80% para 15,80% de energía realmente aprovechado en el riego.
Se
reafirma que los criterios de eficiencia contribuyen a la valorización
de las tecnologías de riego eficientes para la modalidad de proyecto y
en las condiciones específicas de explotación para la óptima
productividad del cultivo, a partir de un uso sostenible de los recursos
naturales; así como permite mejorar la toma de decisión para el
mantenimiento previo.

