INTRODUCTION
Modern diesel engines are used in much of the world's equipment, they are especially the main sources of energy available for personal and commercial automotive transport and they have increasing popularity.
Traditionally, diesel engines run on mineral fuel, which is produced from crude oil. This fact generates three main concerns for the sustainable use of these machines in the future, namely:
The limited world reserves of crude oil. Crude oil covers approximately 37% of the world's energy demands (Asif y Muneer, 2007; Kjarstad y Johnsson, 2009; Kegl, 2012).
The chemical process of transforming fuel energy into mechanical work or, more precisely, into the exhaust emissions of this process. A diesel engine produces mainly CO2, NO, CO, unburned HC and PM emissions (smoke). These emissions contribute negatively to global climate change, general pollution of air, water and soil, as well as in the direct effects on health (cancer, cardiovascular and respiratory problems, ...) (Kegl, 2012).
The large amount of fuel consumed by diesel engines worldwide. The 81% of the energy used for road transport is consumed by diesel engines (Soto et al., 2014). In addition, it is consumed by rail and naval transport, as well as by the generation of electricity, among others. Thus, if efficient alternative diesel fuel is produced, the use of diesel engines will continue to be a problem. For this reason, the reduction of diesel fuel consumption to the minimum possible limits should be a priority, both from these machines’ designing and usage points of view.
For the commercialization of automobiles a certification should be carried out which confirms the real parameters that the engine and the vehicle deliver, the technical specifications they convey according to the manufacturer and that, in addition, they comply with the Mexican and international standards on safety and polluting emissions (Mantilla et al., 2015). To carry out this certification it is necessary to perform tests in which the net or gross parameters of the engine are obtained, as well as other indexes of the vehicle.
The SAE J1995:14 (2014) standard allows obtaining the gross parameters of the engine, while the SAE J1349:11 (2011) standard allows obtaining the net parameters. These standards specify the standard conditions for conducting the tests and provide the methodology to perform the data correction. In case that the test is performed under non-standardized conditions, it can be verified that an engine is delivering the power and torque values that the manufacturer proposes, as well as fuel consumption and other engine indices (Puente and Coyago, 2017).
METHODS
The tests to obtain the engine parameters were made in the Diesel engine laboratory of the Department of Agricultural Mechanical Engineering, belonging to the Autonomous University of Chapingo. The conditions of the test were: atmospheric temperature of 297.15 K (24 ° C), altitude of 2 250 m.s.n.m. with atmospheric pressure of 78 kPa and relative humidity of 38%, obtained from Chapingo Meteorological Observatory.
To make the measurements of the parameters that allow the construction of the characteristic curves of the engine, the following equipment and instruments were used:
Volkswagen SDI 1.9 L engine
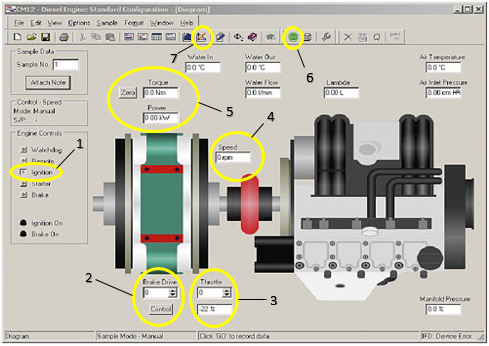
Armfield Diesel Engine Test Bench CM12 (see Figure 1).
Launch Scanner VEA 501 Emission Analizer.
Launch X-431 scanner pro.
Precision electronic balance of 0.1 g.
Precision stopwatch 0.01 s.
Computer with program to operate the test bench.
During the tests of the engine the SAE J1995:14 (2014) standard was used, which establishes the methodology to adjust the "gross" parameters of the internal combustion engine (ICM), such as torque, power, hourly and specific consumption, among others, to normal conditions established.
The "gross" power is obtained when the engine runs without those accessories that are not essential for its operation, leaving the oil and fuel pumps placed. The following accessories were disconnected. The air filter (an air filter can reduce the power by around 2 hp), the mechanical fan of the engine (it can subtract up to 10 hp if it is directly coupled to the engine) and the complete exhaust (the silencer and catalytic converter can subtract between 4 and 6 hp). Others accessories disconnected were the alternator (it absorbs up to 2 hp), the hydraulic steering pump, the anti-pollution system (exhaust gas recirculation), etc. (GOST 18509:88, 1988; SAE J1349:11, 2011; SAE J1995:14, 2014; Castillo et al., 2017; Hernández et al., 2018).
The "net" power is obtained by keeping all the accessories connected as the manufacturer for the engine or vehicle indicates it.
The bench Armfield Diesel Engine CM12, used as a dynamometer brake, has a water pump that replaces the water pump of the Volkswagen 1.9 SDI engine. In addition, the following elements were removed from the engine: catalytic converters, muffler, exhaust pipe, fans, alternator and air filter. The brake is of electrical type of parasitic current, it has a control panel and a device to determine the depression during the air intake. Also, it has software that is installed in a computer to show, on a screen, the multiple possibilities of work (Figure 1). Those possibilities are related to button to start the engine (1), buttons to vary the brake (2), buttons to vary the load (3), indicators of speed (4), indicators of torque and power (5), buttons to save the data (6), buttons to plot the curves (7) and buttons to export the data to Excel in a removable device.
The general methodology of the tests is summarized in the following steps. a) Start the engine, check the proper functioning of all instruments and equipment and bring the engine to its working temperature. b) Place the load in its constant magnitude (100, 75, 50 and 25%), for the speed characteristics or the constant speed (maximum power, 75, 50 and 25% of the first), for the load characteristics. c) Vary the brake of the bank in the magnitudes corresponding to the test regime, d) Stabilize the regime. e) Take the measurement data with the instruments (balance, stopwatch and scanners) and press the green button (6) of Figure 1 to store the dynamometer data. f) Move on to the next measurement and repeat the steps.
The primary data of interest for the present investigation the program of the bank offers are torque ( ), power ) and frequency of rotation or speed of the engine (n). Hourly and specific fuel consumption were determined by two methods: a) using a scale and a stopwatch and, b) using the Launch X-431 pro scanner.
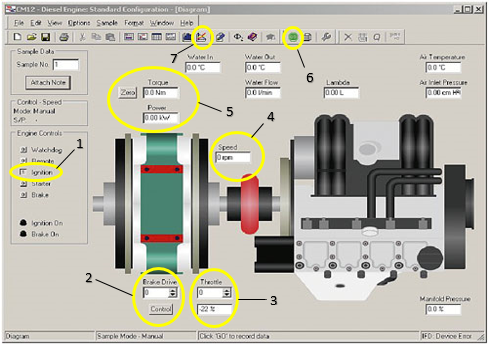
FIGURE 1.
Main screen of the Armfield Diesel engine test program CM12 (Armfield Limited, 2015).
To calculate the hourly consumption by the balance method, the equation used was:
Where
- Fuel consumption during time Δt, in g; Δg = 10 g,
Δt - Time elapsed in consuming Δg grams of fuel, in s.
To calculate the hourly consumption by the Launch X-431 pro Tecnofuel (2015), scanner method, the equation used was:
Where
- Amount of fuel consumed, g / s
- Amount of fuel delivered for each opening, stroke or blow of an injector, mg/emb or mg/str
I - Number of engine cylinders
n - Engine rotation frequency, min-1
The fuel hourly consumption is calculated by the equation:
This procedure is performed for the data capture of the values obtained by the Launch X-431 pro scanner in each of the load and speed tests.
To obtain the specific fuel consumption in [g/kWh] , the equation used was.
Where
- Fuel hourly consumption, in kg/h,
- Effective engine power, in kW.
In this research, two methods of correction or adjustments of the data obtained were used in the conditions of the test to standardized conditions. That allowed comparing and evaluating the engine tested with the manufacturer's technical specification. In general, the GOST 18509:88 (1988) standard establishes that the correction factor of power and specific fuel consumption are calculated by the equations:
Where
- Effective power and specific fuel consumption, respectively, obtained during the tests,
- Correction coefficients of the power and of the specific fuel consumption
The correction coefficients are determined according to the following equations:
The coefficients and parameters found in equations (7) and (8) appear in GOST 18509:88 (1988).
The correction coefficients using the method of the SAE J1995:14 (2014) standard establish that the brake power corrected for the compression ignition engines is calculated by the equation:
- Brake power obtained.
The fuel factor Fc to determine the specific consumption is expressed by the following equation:
The coefficients and parameters found in equations (9) and (10) appear in the SAE J1995 standard.
The coefficient of excess air α or lambda λ index, using the Launch VEA-501 scanner Launch Tech Limited (2016), is determined by applying Joannes Brettschneider's equation, in which the balance between oxygen and fuel is measured by comparing the ratio between the molecules of oxygen and those of carbon and hydrogen in the exhaust gases. The action takes the following form:
Where
- Concentration of each of the exhaust gases in % of the volume,
3.5 - Proportion between CO and CO2,
Number of C atoms in each of the hydrocarbon molecules,
- Proportion of atoms of hydrogen and carbon in the fuel,
- Proportion of atoms of oxygen and carbon in the fuel.
RESULTS AND DISCUSSION
The data obtained was processed with the Office Excel 2016 programs, obtaining the parameters: torque, power, hourly and specific fuel consumption, as well as the theoretical laws of greater adjustment of the variation of these engine effective parameters, in the work area. The theoretical laws were only adjusted to the second order that give results with sufficient precision. The correction coefficients by GOST 18509:88 (1988), obtained were: = 1.22; = 0.89; whereas by the SAE J1995:14 (2014) standard were: brake power = 1.22 and fuel correction factor .
In this way, the following characteristics were obtained (curves of variation of effective engine parameters).
Speed characteristics (with balance and scanner): external (100% constant load) and partial to: 75, 50, and 25% of constant loads.
Load characteristics (with scale and scanner: external to 3747 constant and partial to: 2810, 1860 and 1050 constants.
Speed Characteristics
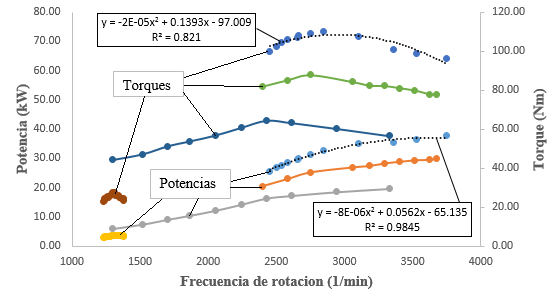
Figure 2 shows the variation of torque and power in the working area of the engine speed characteristics and the theoretical laws of greater adjustment (polynomial) of the torque and the power of the external characteristic. The SAE J1995:14 (2014) and GOST 18509:88 (1988) standards were used to correct the initial data.
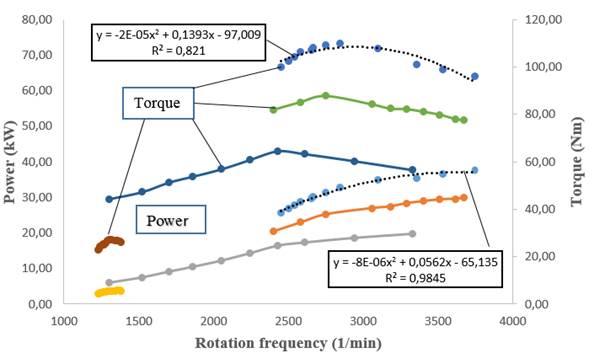
FIGURE 2.
Torques and powers for speed characteristics.
Figure 2 shows that the maximum torque is 110.08 to 2845 min-1 and the maximum power regime is 37.68 kW to 3747 min-1. These regimes do not coincide with those indicated by the manufacturer in their technical specification, which are from 44 kW to 3600 min-1, and represent a decrease of 14.36%. The maximum nominal torque is 130 Nm at 2200 min-1, which represents a decrease of 15.32%. The nominal torque, from the values of power and speed, is 116.17 Nm, having a reserve K= 1.12, that is, 12%; however, the engine tested offers a reserve of 14.6%, representing 2.6% in its favor. The elasticity of the engine, according to data of the specification, shows a Kv = 0.611; the engine test yields a Kv = 0.759, which indicates that the test engine is less elastic in 24.22% and that, moreover, it is not within the values established, between 0.55 - 0.70 (Mayans et al., 2009). The difference of the useful working range is 500 min-1.
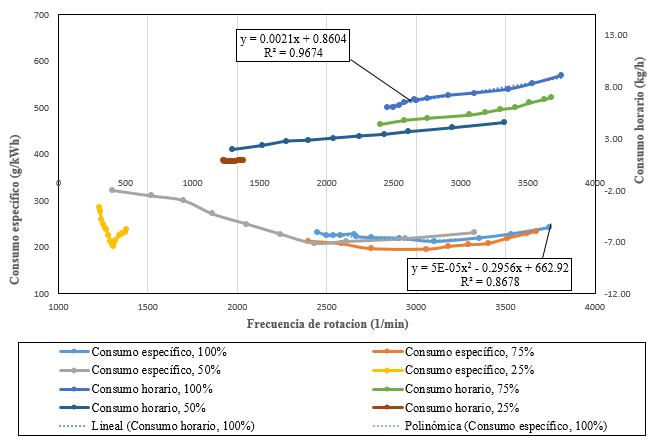
Figure 3 shows the curves of variation of fuel hour and specific fuel consumption corrected, in the work zone, for the different speed characteristics.
Table 1 shows the values of fuel consumption corrected for the different working regimes of the VW 1.9L SDI engine, obtained using the Launch X-431 pro scanner and the method of correction of SAE J1995:14 (2014) standard. The error between the values of fuel consumption using the scale - chronometer and the Launch X-431 pro scanner is less than 5%.
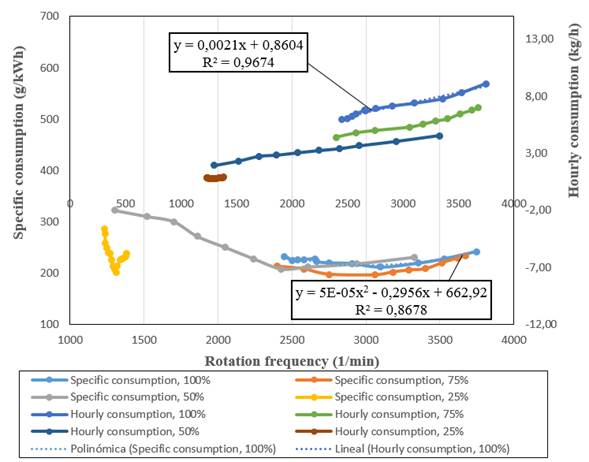
FIGURE 3.
Hourly and specific fuel consumption for speed characteristics.
Charge Characteristics
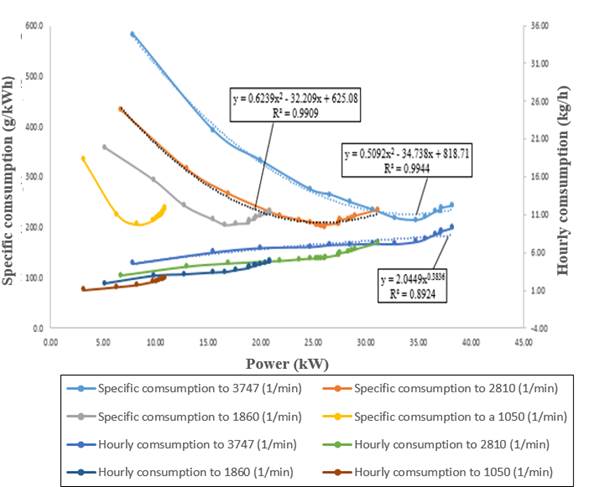
The corrected load characteristic curves that were obtained appear in Figure 4. The values for the hourly and specific fuel consumption curves adjusted by GOST 18509:88 (1988) methodology are obtained by multiplying the values obtained by the SAE J1995:14 (2014) standard by the coefficient 0.885. In addition, the theoretical laws of greater adjustments for some characteristic curves are shown.
Table 2 shows the most representative hourly and specific fuel consumption values obtained using the Launch X-431 pro scanner and adjusted by the SAE J1995:14 (2014) standard.
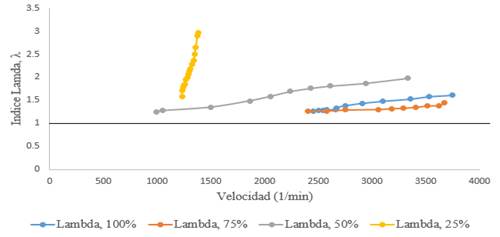
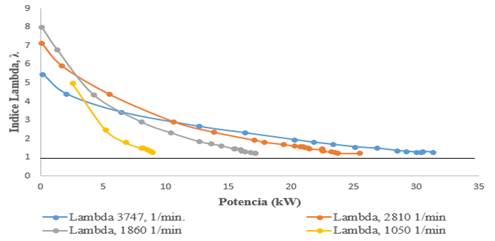
Figures 5 and 6 show the variation of the coefficient of air excess α or lambda index λ as a function of speed and power, respectively.
TABLE 1.
Values of fuel consumption for different speed regimes and characteristics
The values of the lambda index λ for the most relevant regimes in the work area for the different characteristics, obtained with the Launch VEA 501 scanner, can be found in Table 3.
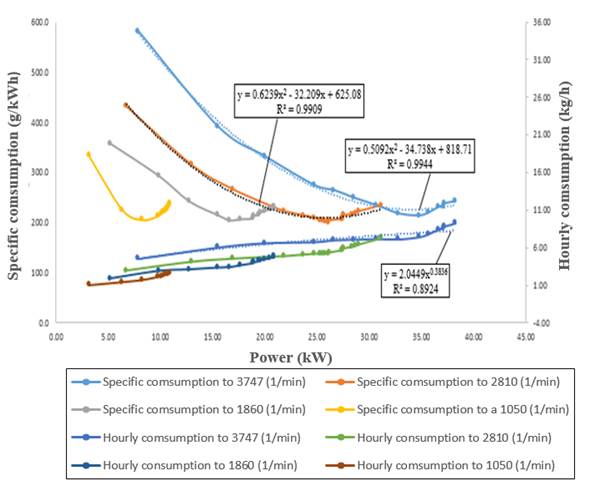
FIGURE 4.
Hourly and specific fuel consumption values for the load characteristics with scanner and corrected with the SAE J1995:14 (2014) standard.
TABLE 2.
Values of the consumptions for different regimes and load characteristics
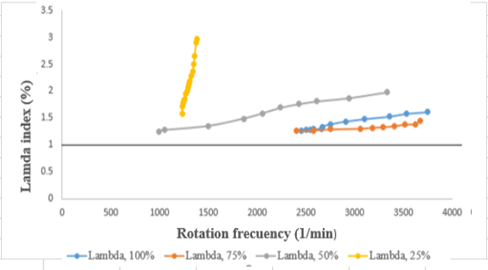
FIGURE 5.
Values of lambda index λ as a function of the speed for the work area.
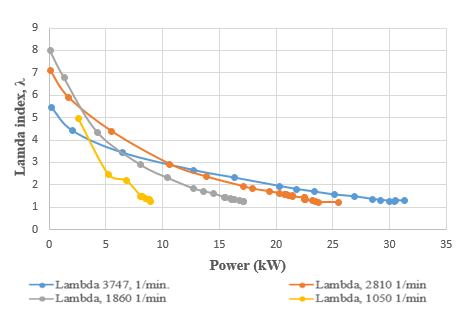
FIGURE 6.
Lambda index values λ as a function of the engine load.
TABLE 3.
Lambda values λ for different characteristics and regimes in the work area
CONCLUSIONS
The maximum power obtained for the speed tests was 37.7 kW at 3747 min-1. These regimes do not coincide with those indicated by the manufacturer in their technical specification, which are from 44 kW to 3600 min-1 (nominal regime). That represents a decrease of 16.71%.
The maximum torque obtained is 110.08 Nm at 2905 min-1 and the manufacturer's maximum torque is 130 Nm at 2200 min-1. That represents a decrease of 18.1%.
The torque at nominal regime, from the values of power and speed is 116.17 Nm, having a reserve K of 1.119 = 1.12, that is, 12%; however, the engine tested offers a reserve of 14.5%, representing 2.5% in its favor.
Regarding elasticity, the technical specification states that Kv = 0.611 and the engine test yields a Kv = 0.775. That means that the test engine is less elastic in 26.84% and that, moreover, it is not within the values established between 0.55 - 0.70.
For the external characteristic of speed, the minimum specific consumption was 156 to 2578 min-1 with the GOST 18509 standard and from 183 to 2578 min-1 for the SAE J1995 standard, which represents a difference of 17.3%.
The average maximum specific consumption in the load characteristics was 236.2 gkW-1h-1, with the minimum average of 207.05 gkW-1h-1. The minimum values of specific fuel consumptions were obtained for the loads of 75 and 50%, with values of 204.1 and 204.5 gkW-1h-1, which correspond to the regimes of greater use in practice of this type of engine for automobiles.
The average values of lambda λ of the velocity characteristics of minimum depletion were 1.26 and the maximum value was 2.00, observing that as the engine load decreases, the lambda λ index increases. For the characteristics of load, it was obtained that the average of minimum depletion was of 1.25 and the average of maximum depletion was of 6.39. The above corroborates the theory of Jovaj (1982) who states that the lambda coefficient varies from 5 and more to small loads and up to 1.4 - 1.25 at full load.

