Translate PaperOriginal Article http://opn.to/a/B0GyK
Spatial-Temporal Characterization of Coverage with the Use of Geoinformation in Miranda Municipality
MSc. Lexa Dayana Pineda-Santos [I] [*]
MSc. Jorge Eduardo Suárez-Hernández [I]
[*] Author for correspondence: Lexa Dayana Pineda-Santos, e-mail: lexapineda@gmail.com
ABSTRACTThe municipality of Miranda, in Trujillo State, is crossed by Pan-American Highway, which is the most important road in the lower area of the state. Its agricultural areas are watered by El Cenizo irrigation system and by other natural channels. The main agricultural activity is sugarcane crop. A characterization of the contamination was made from information taken in the field (years 2014 and 2018) and the use of three satellite images (Landsat 7 and Landsat 8) corresponding to the year 2000, 2014 and 2107. It began with the differentiation of seven classes ratified by the dendogram of the classes and validated by statistical tests; a supervised classification was subsequently applied from the spectral values (for each date). As a result, a thematic map in a measurable raster format of spatial-temporal changes was generated, where expansion of the area destined to agricultural activities of 44.45 km2 was identified for 2017, which corresponds to a decrease in forest of 27.26 km2 and occupation of new areas that were previously shown as unoccupied soils. With this information, generated together with georeferenced photographic evidences, it was complemented with vector layers of cartography, and edaphoclimatic information so that together it functions as a dynamic Geographic Information System (GIS) of consultation for agricultural planning.
INTRODUCTIONAgriculture represents the highest proportion of land use by man. Problems derived from agricultural practices are old and, according to a set of studies carried out in various countries by Shortle and Abler (2001), agricultural sector is the main user of soil and water resources and is their most important polluter. The magnitude of efforts currently achieved by agriculture, with the aim of increasing agricultural productivity and profitability, has contributed greatly to environmental deterioration. Agricultural production in general, due to its direct influence on soil, water, vegetation and air, is considered one of the activities whose execution must be very controlled to avoid affectations that, over time, can become irreversible (Milanes, 2009). In this context, it is desirable to characterize degrees of intensification of agriculture with temporary frequencies that are opportune for those who plan and make decisions.
The research carried out for the analysis of environmental pollution, projects and human management on ecosystems in general, have been based on the use of fieldwork techniques to identify the impacts on ecosystems. These techniques are based on the determination of environmental indicators, which are an ideal tool to carry out the monitoring through the systematic collection of data obtained by means of measurements or observations in series of space and time. They provide quickly the knowledge of the initial state and the evolution of the transformation of the area in time. They constitute information that, once processed, allows analysis and decision-making, as well as retrieving existing information about a specific area. Environmental indicators are also obtained by determining the environmental coefficient index (Reyes et al., 2010) and through life cycle analyses (Gómez et al., 2008).
The results of the application of these methods, for the analysis of the environmental impact, are influenced by the field work carried out by the evaluation team. It has as main disadvantages the on-site inspection of all the areas to be evaluated, which when inspected a large area are usually very distant and scattered by the geography of the region to be investigated. These difficulties associated with the methods that have traditionally been used for the analysis of environmental impact can be solved through the application of geoinformation technologies (Alonso del Val et al., 2008).
Geoinformation technologies are current and efficient methods that include the use of satellite technology of Earth observation (TSOT), GIS, global positioning systems (GPS), and digital cartography, among the main ones (Ponvert y Lau, 2013). Those together allows satisfying the need to generate information about the territory in thematic maps and dynamic GIS that provide answers to queries for the subsequent activities management of planning, mitigation and conservation of resources. For Rodríguez et al. (2015) the use of GIS is a useful tool for the planning of technical assistance with a territorial approach, since this technology allows the identification of levels of technological adoption by sectors within the territory, contributing to improve the efficiency in the use of resources by reducing subjectivity in decision-making based on the definition of solution alternatives adjusted to local needs and the handling of information to monitor and evaluate the technical assistance service.
The use of GIS represents a tool for the assessment of impacts, for the planning and management of natural spaces since it provides a better knowledge of the study area (Montoya et al., 2004; Pineda y Suárez, 2014; Rodríguez et al., 2015). Smith et al. (2014), point out that linking information to GIS allows modeling the behavior of a future situation, creating early warnings, estimating parameters that depend on or influence some process, and make predictions of the impact generated by the realization of the activities in the productive process.
Based on the previously mentioned information, the objective is to characterize, at a spatial-temporal level, land uses caused by agricultural activity in Miranda Municipality area, using geoinformation technologies combined with "in situ" observation techniques.
METHODSThe area under study is located according to the projection system WGS_1984_UTM_Zona_19N between the coordinates 300000 - 340000 EAST and 1040000 - 1080000 NORTH that delimit Miranda Municipality, which is located to the northwest of Trujillo State, Venezuela and covers an area of approximately 374 km2 , which represents 4.65% of the state.
Cartography: Taking as base the orthophotomaps and linear maps in digital format of Trujillano Hydraulic System (SHT) at a scale of 1: 25000, the letters covering the surface of the municipality (6045BSO, 6045BSE, 6044ANO, 6044ANE, 6044DSE, 6044CNE, 6044BNO and 6044BNE ) in order to delimit and obtain the altimetric information of the municipality, the software AutoCAD version 2010 was used.
Spatial-temporal characterization: GoogleEarth images dated 4/10/2014, captured in the software application were used, and as primordial information the images of three dates (2000, 2014 and 2017) of the Landsat satellites downloaded from the http website : //glovis.usgs.gov/ whose characteristics are shown in Table 1. The reference to the similarity and alignment of the bands in both satellites (Landsat 8 and Landsat 7) as published by ArcGISResources (2013), can be seen in Table 2.
Due to the radiometric resolution or sensitivity of ND of Landsat 7 (8 bits = 256 gray tones), unlike Landsat 8, that are of 16 bits = 65,536 gray tones, it is necessary to equal the radiances. In this regard, Ariza (2013) noted that Landsat products, supplied by USGS EROS CENTER, consist of a quantized, calibrated and scaled series of digital levels ND. The data of the bands are derived in bits in non-encrypted format and can be rescaled to the reflectance and / or radiance values in the roof of the TOA atmosphere, using the radiometric coefficients provided in the MTL.txt metadata file, as described in expression (1) below:
(1)
Where:- It is the value of spectral radiance in the roof of the atmosphere (TOA) measured in values of (W / m2 srad μm)
- Band - It is the multiplicative factor of specific scaling obtained from the metadata (RADIANCE_MULT_BAND_x,)
- It is the specific scaling additive factor obtained from the metadata (RADIANCE_ADD_BAND_x)
- Standard product quantified and calibrated by pixel values (DN).
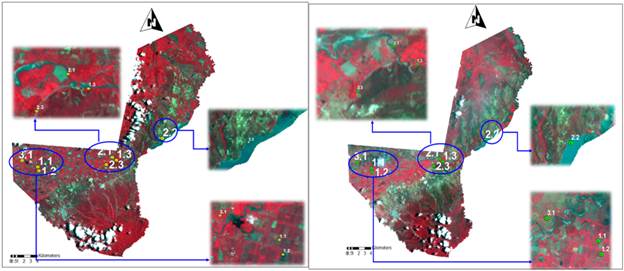
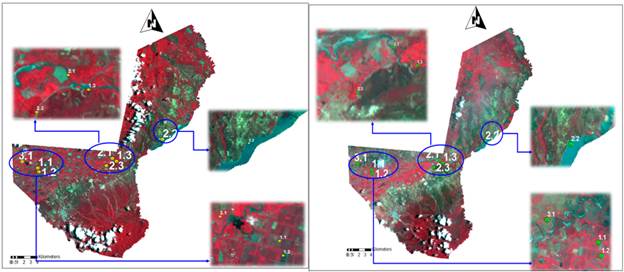
To complete this aspect related to the spatial-temporal variability of the different ecosystems and environmental services, the visual-digital analysis of the satellite images corresponding to the year 2000 and 2014 was performed. In the images (Figure 1), referring to the same points of coordinates (taken in the field in 2014), the following ecosystems are highlighted. Vegetation (1): composed of agricultural crops (1.1) (sugarcane, papaya, banana, etc.) grasses and herbaceous vegetation (1.2); shrub vegetation and forests (1.3). Water (2): integrated by the banks of Motatán River (2.1), Agua Viva dam (2.2) that supplies the irrigation system "El Cenizo" existing in the study area, and the irrigation channels for the supply of the recourse to crops (2.3). Soils (3): where bare soils appear (3.1) corresponding to burned areas and others in tillage and preparation (3.2), although most of the territory appears as soils covered by different types of vegetation and others.
(a) Fragment of the image Landsat 7 ETM of the year 2000, RGB: 432 and (b) Fragment of the image Landsat 8 OLI_TIRS of the year 2014, RGB: 543.
Table 3 highlights the ecosystems and environmental services observed in the field and referred to the coordinate system at the points where they were observed in 2014, and it is appreciated that there are visual changes in most of them. Because there is no real evidence of contamination for the year 2000, it can be inferred that the evidence from 2014 constitutes the basis for assuming that these changes are primarily due to agricultural activities that influence the variations of the ecosystems appreciated.
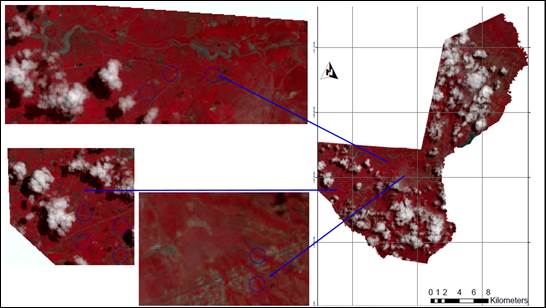
In the same way, in 2018, coordinates were validated in the field referring to agricultural crops that were observed in the 2017 image, which according to Duarte et al. (2017), is used to correct a use map and / or to validate it. It is very remarkable a growth in the cultivated area, denoted by the appreciation of red color that shows the vegetation in the combination of bands (543), including areas that previous years were without any vegetation (bare). It was validated in field that they were being cultivated as it can be seen in figure 2.
Fragment of the image Landsat 8 OLI_TIRS of the year 2017, RGB: 543.
The analysis of the spatial distribution of the main ecosystems is carried out with the visual-digital method of interpretation of satellite images, for the years 2000, 2014 and 2017. The different coverage or classes (differentiated in the images) represent a signature by radiance values each of the bands. Then, the methods and tools used are described sequentially.
In the image fragments, differentiating the colors and tonalities, a layer of points was made in .shp format and 60 pixels were identified for each of the appreciable classes (resulting in seven differentiated classes). This process is carried out in each of the images (three years), in order to determine the classes for a later supervised classification of them. This classification constitutes the result of the temporal spatial characterization. With the pixels sampled in each class an output file is created in .gsg format, containing the spectral response (spectral signature) of the classes, it stores the statistical data of the classes in each of the bands. These statistical data were used to compare the classes and determine that there are significant differences between the means of the classes, using tools of inferential statistical comparison of samples; the software used for the analysis is STATGRAPHIS Centurion. If there are no differences, the process is repeated to determine the classes (resample the points to create the classes again), and, in this way, to make the spectral values precise, before performing the supervised classification.
A dendrogram (tree outline) is also generated in the ArcGIS 10.1 software for each created signature file (year 2000, 2014 and 2107) in a text file to see the differences and similarities between classes. This text file generates two components: the first component is a table of distances between pairs of classes, presented in the sequence for the fusion. The second component is a graphical representation of the classes, made with ASCII characters, which demonstrates the relationships and hierarchy of the fusion. The graph illustrates the relative distances between pairs of merged classes in the signature file, which are based on statistically determined similarities. The classes themselves represent clusters of cells or cells of training samples drawn from the study site. In this way, the potential of the merged classes is determined.
The dendrogram is validated with Fisher's Multiple Minimum Difference Test procedure (LSD), using the statistical software.
The classification method used was that of maximum likelihood on the set of the 3 raster bands aligned on both satellites, and it created an output raster with the specified classes. The tool takes into account the variances and covariances of the class signatures when it assigns each cell to one of the classes represented in the signature file, to then, make a visual comparison of the classified maps.
Seven classes will be contemplated for the classification. Class 1 corresponds to agricultural vegetation. Class 2 are soils with stubble or in preparation activities. They correspond to observations in the field, recorded with the GPS, of sugarcane plots that had been burned for the harvest, as well as "new" plots with recent logging activities (ready to be incorporated into agricultural crops). These two classes are closely related to agricultural activities. Class 3 corresponds to the vegetation of dense forest. Class 4 are bodies of water. Class 5 refers to infrastructures and floors provided with cover. They were considered as a single class because the colors and shades in different RGB combinations look similar. Classes 6 and 7 discriminate shadows and clouds, respectively.
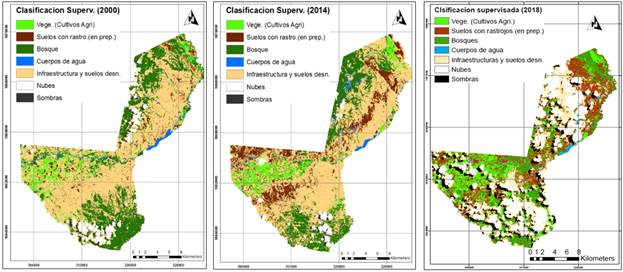
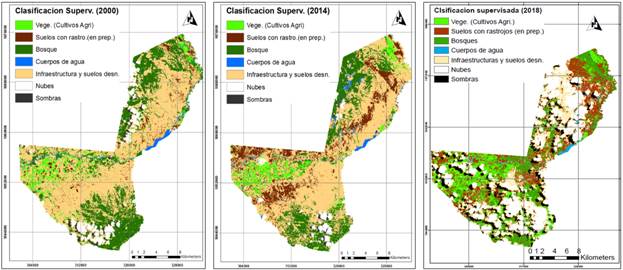
RESULTS AND DISCUSSIONIn correspondence with the methods described above, the results of the spatial-temporal comparison that is shown by a thematic representation of the main classes for each of the analyzed years is analyzed and discussed as shown in Figure 3.
(a) Supervised Classification of Miranda Municipality corresponding to the year 2000, (b) Supervised Classification of Miranda Municipality corresponding to the year 2014. (c) Supervised Classification of Miranda Municipality for the year 2017.
Table 4 includes the amount of area classified for each class expressed in km2 in the three resulting maps. The area of vegetation remains practically constant from 2000 to 2014 and, in the last three years, it has increased notably by 44.45 km2, unlike bare soils (which reflect preparatory work), increased by approximately 37 km2 in 2014 and in the following 39.35 km2.
Greater area of water bodies is denoted for the years 2014 and 2017 because these two images present a greater amount of shadows that generate clouds and are confused with bodies of water. It is a somewhat erroneous result because of the confusion due to the similarity of the Spectral response in the pixels. That similarity is appreciated in each of the dates studied in the dendograms of the spectral classes. As regards the infrastructure class and completely bare soils, they show an increase of 1.18 km2 approximately for 2014, which indicates urban, industrial and soil growth with erosion problems. In 2017 a considerable reduction is seen of 103.3 km2, specifically for the occupation of these areas in agricultural crops and also to the overlap generated by the amount of clouds and shadows (class 6 and 7 respectively) in the image of 2017 (occupation that was validated in the field, specifically in these overlapping areas).
As for the areas of dense forest, there is a successive decrease of approximately 27.26 km2 for the year 2017, which denotes a growth of the agricultural frontier. These variations, although in some of the classes are small, can have a reflection of the spatial variability and, at the same time, they are associated to the increase of the agricultural activity. The expansion of the agricultural frontier and the extraction of the forest resource, is what generally predominates in the studies of temporal space comparison related to the coverage or uses of land, and are directly associated with the dynamics of change of growth of the agricultural frontier (Bocco et al., 2001; Cabral, 2011; Orozco et al., 2015; Fragoso, 2017).
CONCLUSIONSThe digital visual analysis referred to the spatial-temporal variability denotes the characteristics of environmental contamination product of an intensive agricultural activity, in the time of approximately 18 years. The measurable result in terms of area denotes a growth of 44.45 km2 in agricultural areas for the year 2017, which corresponds to a decrease in forests of 27.26 km2 and a decrease in the area designated as bare soils, specifically in the year 2107.
The image of 2014 presents a greater number of cells classified without clouds and shadows, so, it is more appropriate to take the information on bodies of water and infrastructure that does not show much variability over time, from this image. In that image, it is observed that the territory has populated areas, infrastructures supporting agricultural production (roads, warehouses, agro-industry, etc.), and eroded soils more than 55% and that the bodies of water practically remain constant and occupy approximately 1.79% of the municipality surface.
The information referring to the spectral characteristics of the different coverage in the area occupied by the municipality and those generated in the thematic maps, as well as the edaphoclimatic information, make up a small GIS of the environmental characterization of the municipality, being available for environmental plans.
INTRODUCCIÓNLa agricultura representa la mayor proporción de uso de la tierra por el hombre, los problemas derivados de las prácticas agrícolas son antiguos, y de acuerdo con un conjunto de estudios llevados a cabo en diversos países por Shortle y Abler (2001) el sector agropecuario es el principal usuario de los recursos suelo y agua y es su más importante contaminador. La magnitud de los esfuerzos que actualmente alcanza la agricultura, con el afán de elevar productividad y rentabilidad agrícola, ha contribuido grandemente al deterioro ambiental. La producción agrícola en general, por tener influencia directa en el suelo, las aguas, la vegetación y el aire es considerada como una de las actividades que su ejecución debe ser muy controlada para evitar afectaciones que de repetirse en el tiempo pueden llegar a convertirse en irreversibles (Milanes, 2009). En este contexto, lo deseable es caracterizar grados de intensificación de la agricultura con frecuencias temporales que resulten oportunos para quienes planifiquen y tomen decisiones.
Las investigaciones realizadas para el análisis de contaminación ambiental, de proyectos y de la gestión humana sobre los ecosistemas en general, han estado fundamentadas en el empleo de técnicas de trabajos de campo para identificar los impactos a los ecosistemas. Estas técnicas se basan en la determinación de indicadores ambientales, los cuales son una herramienta ideal para efectuar el monitoreo a través de la recolección sistemática de datos obtenidos mediante mediciones u observaciones en series de espacio y tiempo. Proporcionan de manera rápida el conocimiento del estado inicial y la evolución de la transformación del área en el tiempo. Constituyen información que, una vez procesada, permite el análisis y la adopción de decisiones, como también rescatar información existente sobre un área específica. Los indicadores ambientales también son obtenidos mediante la determinación del índice del coeficiente ambiental según Reyes et al. (2010) y mediante los análisis de ciclo de vida (Gómez et al., 2008).
Los resultados de la aplicación de estos métodos, para el análisis del impacto ambiental, están influenciados por el trabajo de campo realizado por el equipo de evaluación. Tiene como principales desventajas la inspección in situ de todas las áreas a evaluar, las cuales cuando se inspecciona una extensa zona suelen estar muy distantes y dispersas por la geografía de la región a investigar. Estas dificultades asociadas a los métodos que tradicionalmente se han utilizado para el análisis del impacto ambiental pueden ser resueltas mediante la aplicación de las tecnologías de geoinformación (Alonso del Val et al., 2008).
Las tecnologías de geoinformación constituyen métodos actuales y eficientes que abarcan el empleo de la tecnología satelital de observación de la Tierra (TSOT), los SIG, los sistemas de posicionamiento global (GPS), y la cartografía digital, entre los principales (Ponvert y Lau, 2013). Que en conjunto permiten satisfacer la necesidad de generar información sobre el territorio en mapas temáticos y SIG dinámicos que brinden respuesta a consultas para la posterior gestión de actividades de planificación, mitigación y conservación de los recursos. Para, Rodríguez et al. (2015), el uso del SIG es una herramienta útil para la planificación de la asistencia técnica con enfoque territorial, ya que esta tecnología permite la identificación de niveles de adopción tecnológica por sectores dentro del territorio, contribuyendo a mejorar la eficiencia en el uso de los recursos al disminuir la subjetividad en la toma de decisiones a partir de la definición de alternativas de solución ajustadas a las necesidades locales y el manejo de la información para realizar seguimiento y evaluación del servicio de asistencia técnica.
La utilización de un SIG representa una herramienta para la valoración de los impactos, para la planificación y gestión de los espacios naturales ya que proporcionan un mejor conocimiento del área de estudio (Montoya et al., 2004; Pineda y Suárez, 2014; Rodríguez et al., 2015). Al respecto indican Smith et al. (2014) que la vinculación de la información a los SIG permite modelar el comportamiento de una situación a futuro, crear alertas tempranas, estimar parámetros que dependen o influyen en algún proceso, y hacer predicciones del impacto generado por la realización de las actividades en el proceso productivo.
Con base a la información señalada previamente, se tiene como objetivo caracterizar a nivel espacio-temporal los usos del suelo provocado por la actividad agrícola en la zona del municipio Miranda, utilizando las tecnologías de geoinformación combinadas con las técnicas de observación “in situ”.
MÉTODOSLa zona objeto de estudio se localiza según el sistema de proyección WGS_1984_UTM_Zona_19N entre las coordenadas 300000 - 340000 ESTE y 1040000 - 1080000 NORTE que delimitan el Municipio Miranda, el cual se ubica al NorOeste del Estado Trujillo, Venezuela y abarca una superficie de 374 km2 aproximadamente, lo que representa el 4,65% del estado.
Cartografía: tomando como base los ortofotomapas y mapas lineales en formato digital del Sistema Hidráulico Trujillano (SHT) a escala 1: 25000, las cartas que cubren la superficie del Municipio (6045BSO, 6045BSE, 6044ANO, 6044ANE, 6044DSE, 6044CNE, 6044BNO y 6044BNE) para delimitar y obtener la información altimétrica del municipio se empleó el software AutoCAD versión 2010.
Caracterización espacio-temporal: se empleó las imágenes del GoogleEarth de fecha 4/10/2014 capturadas en la aplicación del software, y como información primordial las imágenes de tres fechas (2000, 2014 y 2017) de los satélites Landsat descargadas del sitio web http://glovis.usgs.gov/ cuyas características se muestran en la Tabla 1. Lo referente a la similitud y alineación de las bandas en ambos satélites (Landsat 8 y Landsat 7) según publica ArcGISResources (2013), se aprecian en la Tabla 2.
Debido a la resolución radiométrica o sensibilidad de ND del Landsat 7 (8 bits = 256 tonos de grises) a diferencia del Landsat 8 que son de (16 bits = 65 536 tonos de grises) se hace necesario igualar las radiancias. Al respecto Ariza (2013), señala que los productos Landsat suministrados por el USGS EROS CENTER consisten en una serie cuantificada, calibrada y escalada de niveles digitales ND, los datos de las bandas están derivados en bits en formato no cifrado y pueden ser reescalados a los valores de reflectancia y/o radiancia en el techo de la atmósfera TOA, usando para ello los coeficientes radiométricos provistos en el archivo de metadato MTL.txt, tal y como se describe a continuación en la expresión (1):
(1)
donde:- Es el valor de radiancia espectral en el techo de la atmósfera (TOA) medida en valores de (W / m2 srad μm)
-Banda - Es el factor multiplicativo de escalado específico obtenido del metadato (RADIANCE_MULT_BAND_x,)
-Es el factor aditivo de escalado específico obtenido del metadato (RADIANCE_ADD_BAND_x)
- Producto estándar cuantificado y calibrado por valores de pixel (DN).
Para cumplimentar este aspecto relacionado con la variabilidad espacio-temporal de los diferentes ecosistemas y servicios ambientales se realizó el análisis visual-digital de las imágenes de satélite correspondiente al año 2000 y 2014. En las imágenes (Figura 1), referidos a los mismos puntos de coordenadas (tomados en campo en el año 2014) se destacan los ecosistemas siguientes: vegetación (1): compuesta por cultivos agrícolas (1.1) (caña de azúcar, lechosa, plátano, etc.) pastos y vegetación herbácea (1.2); vegetación arbustiva y bosques (1.3); Agua (2): integrada por los causes del río Motatán (2.1), la represa de Agua Viva (2.2) que surte al sistema de riego “El Cenizo” existente en el área de estudio, y los canales de riego para el suministro del recurso a los cultivos (2.3); Suelos (3): donde aparecen suelos desnudos (3.1) correspondientes a aéreas quemadas y otras en laboreo y preparación (3.2), aunque la mayor parte del territorio aparece como suelos cubiertos por distintos tipos de vegetación y otras.
(a) Fragmento de la imagen Landsat 7 ETM del año 2000, RGB: 432 y (b) Fragmento de la imagen Landsat 8 OLI_TIRS del año 2014, RGB: 543.
En la Tabla 3 destacan los ecosistemas y servicios ambientales observados en campo y referidos al sistema de coordenadas en los puntos donde se observaron en el año 2014, y se aprecia que existen cambios a nivel visual en la mayoría de ellos. Debido a que se carece de evidencias reales de contaminación para el año 2000 se infiere que las evidencias del año 2014 constituye la base para suponer que estos cambios se deben primordialmente a las actividades agrícolas que influyen en las variaciones de los ecosistemas apreciados.
De igual manera en el año 2018 se validó en campo puntos de coordenadas referentes a cultivos agrícolas que se observaron en la imagen del 2017, que según Duarte et al. (2017), se utiliza para corregir un mapa de uso y/o para validarlo. Resulta muy notable un crecimiento en cuanto al área cultivada, denotándose por la apreciación de color rojo que muestra la vegetación en la combinación de bandas (543), incluyendo áreas que años anteriores estaban sin vegetación alguna (desnudos), se validó en campo que estaban siendo cultivadas como puede observarse en la Figura 2.
Fragmento de la imagen Landsat 8 OLI_TIRS del año 2017, RGB: 543.
Los análisis de la distribución espacial de los principales ecosistemas, se realizan con el método visual-digital de interpretación de las imágenes de satélites, para los años 2000, 2014 y 2017, las diferentes coberturas o clases (diferenciadas en las imágenes), representan una firma por los valores de radiancia cada una de las bandas, a continuación se describe de manera secuencial los métodos y herramientas empleadas.
En el fragmentos de imagen diferenciando los colores y tonalidades se realizó una capa de puntos en formato .shp y se identificaron 60 pixeles para cada una de las clases apreciables (resultando siete clases diferenciadas), este proceso se realiza en cada una de las imágenes (tres años), con el fin de determinar las clases para una posterior clasificación supervisada de las misma, (esta clasificación constituye el resultado de la caracterización espacial temporal). Con los pixeles muestreados en cada clase se crea un archivo de salida en formato .gsg, contentivo de la repuesta espectral (firma espectral) de las clases, el mismo almacena los datos estadísticos de las clases en cada una de las bandas, estos datos estadísticos se emplearon para comparar las clases y determinar que haya diferencias significativas entre las medias de las clases, empleando herramientas de estadística inferencial de comparación de muestras, el software empleado para el análisis es STATGRAPHIS Centurion. En caso de no existir diferencias se repite el proceso para determinar las clases (volver a muestrear los puntos para crear nuevamente las clases), y de esta manera hacer preciso los valores espectrales antes de realizar la clasificación supervisada.
También se genera un dendograma (esquema de árbol) en el software ArcGIS 10.1 para cada archivo de firma creado (año 2000, 2014 y 2107) en un archivo de texto para ver las diferencias y similitudes entre clases. Este archivo de texto genera dos componentes: el primer componente es una tabla de distancias entre pares de clases, presentadas en la secuencia para la fusión. El segundo componente es una representación gráfica de las clases, hecha con caracteres ASCII, que demuestra las relaciones y la jerarquía de la fusión. El gráfico ilustra las distancias relativas entre los pares de clases fusionadas en el archivo de firma, las cuales están basadas en similitudes determinadas estadísticamente. Las clases en sí mismas representan clusters de celdas o celdas de muestras de capacitación extraídas del sitio de estudio. De esta manera se determina el potencial de las clases fusionadas.
El dendograma es validado con la prueba de rangos múltiples de procedimiento de diferencia mínima significativa (LSD) de Fisher, empleando el software estadístico.
El método de clasificación empleado fue el de máxima verosimilitud sobre el conjunto de las 3 bandas ráster alineadas en ambos satélites, y crea un ráster de salida con las clases especificadas. La herramienta tiene en cuenta las varianzas y covarianzas de las firmas de clases cuando asigna cada celda a una de las clases representadas en el archivo de firma. Para luego realizar una comparación visual de los mapas clasificados.
Se contemplaran siete clases para la clasificación: la clase 1 se corresponde a la vegetación agrícola , en la clase 2: son suelos con rastrojos o en actividades de preparación, se corresponden con observaciones en campo (registradas con el GPS) de tablones de caña de azúcar que habían sido quemados para la cosecha, así como parcelas “nuevas” con recientes actividades de tala (prontas a ser incorporadas a siembras agrícolas), estando estas dos clases estrechamente relacionadas con las actividades agrícolas, la clase 3: corresponde a la vegetación de bosque denso, la clase 4: cuerpos de agua, la clase 5 está referida a infraestructuras y a suelos provistos de cobertura se contempló como una sola clase debido a que los colores y tonalidades en diferentes combinaciones RGB se ven similares. En las clases 6 y 7 se discriminan las sombras y nubes respectivamente.
RESULTADOS Y DISCUSIÓNEn correspondencia con los métodos descritos anteriormente, se analiza y discute los resultados de la comparación espacial-temporal que se muestra mediante una representación temática de las principales clases para cada uno de los años analizados como se muestra en la Figura 3.
(a) Clasificación supervisada del Municipio Miranda correspondiente año 2000, (b) Clasificación supervisada del Municipio Miranda correspondiente al año 2014. (c) Clasificación supervisada del Municipio Miranda correspondiente al año 2017.
La Tabla 4. Contempla la cantidad de área clasificada para cada clase expresada en km2 en los tres mapas resultantes. El área de vegetación se mantiene prácticamente constante dentro del año 2000 al 2014 e incrementando notablemente en los últimos tres años aproximadamente 44,45 km2, a diferencia de los suelos desnudos (que reflejan labores de preparación) aumentó aproximadamente en 37 km2 para el año 2014 y en lo sucesivo un 39,35 km2.
Se denota mayor área de cuerpos de agua para el año 2014 y 2017 debido a que estas dos imágenes presentan mayor cantidad de sombras que generan las nubes y se confunden con los cuerpos de agua, resultado un tanto erróneo debido a confusión por la similitud de la respuesta espectral en los pixeles, dicha similitud es apreciada en cada una de las fechas estudiadas en los dendogramas de las clases espectrales. En lo que respecta a la clase infraestructura y suelos completamente desnudos denota un incremento para el año 2014 de aproximadamente 1,18 km2 lo que denota un crecimiento urbanístico, industrial y suelos con problemas de erosión, y en el año 2017 se ve una reducción considerable de 103,3 km2, específicamente por la ocupación de estas áreas en cultivos agrícolas y también al solapamiento que genera la cantidad de nubes y sombras (clase 6 y 7 respectivamente) en la imagen del 2017 (ocupación que logró validarse en campo, específicamente en estas áreas solapadas).
En cuanto a las áreas de bosque denso hay un decrecimiento sucesivo de aproximadamente 27,26 km2 para el año 2017, lo que denota un crecimiento de la frontera agrícola. Estas variaciones aunque en algunas de las clases es pequeña pueden tener un reflejo de la variabilidad espacial y a su vez están asociadas al incremento de la actividad agrícola. La expansión de la frontera agropecuaria y la extracción del recurso del bosque, es lo que generalmente predomina en los estudios de comparación espacio temporal relacionados con la cobertura o usos de suelo, y están directamente asociadas con las dinámicas de cambio de crecimiento de la frontera agrícola (Bocco et al., 2001; Cabral, 2011; Orozco et al., 2015; Fragoso, 2017).
CONCLUSIONESEl análisis visual digital referido a la variabilidad espacial-temporal denota las características de contaminación ambiental producto de una intensiva actividad agrícola, en el tiempo de aproximadamente 18 años, el resultado mensurable en términos de área denota un crecimiento de 44,45 km2 en las áreas agrícolas para el año 2017, lo que se corresponde en disminución de los bosques del 27,26 km2 y una disminución del área señalada como suelos desnudos específicamente en el año 2107.
La imagen del año 2014 presenta mayor cantidad de celdas clasificadas sin nubes y sombras por lo que la información de cuerpos de agua e infraestructura que a lo largo del tiempo no presenta mucha variabilidad es más adecuado tomarla de esta imagen, denotándose en ella que el territorio denota zonas pobladas, infraestructuras de apoyo a la producción agrícola (vías, galpones, agroindustria, etc.), y suelos erosionados más del 55% y que los cuerpos de agua prácticamente se mantienen constantes y ocupan aproximadamente el 1,79% de la superficie del municipio.
Las informaciones referentes a las características espectrales de las distintas coberturas en la superficie que ocupa el municipio y las generadas en los mapas temáticos, así como la información edafoclimática, conforman un pequeño SIG de la caracterización ambiental del municipio, quedando a disposición para planes ambientales.

