Translate PaperSOFTWARE http://opn.to/a/qct5E
Software for the Hydraulic Design of Central Pivot Irrigation Systems
[I] Universidad de Ciego de Ávila (UNICA), Facultad de Ciencias Técnicas, Centro de Estudios Hidrotécnicos, Ciego de Ávila, Cuba.
[II] Universidad Agraria de La Habana (UNAH), Facultad de Ciencias Técnicas, San José de las Lajas, Mayabeque, Cuba.
[*] Correspondence to autor: Maiquel López-Silva. e-mail: maiquel@unica.cu
ABSTRACTCurvePivot 2.0 software was developed for the hydraulic design of central pivot irrigation systems for specific operating conditions. The programming language that was used was C # with a simple interface for the user. The program was based on a mathematical model that considers hydrogeological, hydraulic, edaphic, agronomic and economic variables, through which the design flow is obtained quickly and efficiently with the lowest investment and operation cost of the irrigation system. In addition, other parameters are determined like efficiency and depletion of the well, radius of influence of the well, parameters of the centrifugal pump, operating point of the system, rainfall at the end of the lateral, diameters and lengths of the pipes, working pressure, tower number and speed of the last tower. This tool has been used in several agricultural companies in the province of Ciego de Ávila, Cuba.
INTRODUCTIONSoftware in recent decades has become an effective tool in the designing and management of irrigation systems, with the aim of maximizing agricultural production with efficient use of natural resources, as a low-cost alternative, quick and easy to use (Kisekka et al. 2016, Ferreira and Assunção, 2015, Pinheiro and Alves, 2017).
In the Ministry of Agriculture of the Republic of Cuba, pressure irrigation systems are the ones with the highest consumption of electric power, between 18% and 20% (López et al. 2017a). Hence, it arises the need of analyzing the design, operation and evaluation of these systems. In Cuba, in the nineties, the software "PIVOT" was developed for the design of central pivot irrigation systems by hydraulic and electric drive, but this does not include the hydrogeological parameter, the hydraulic in all its extension and the economic ones ( López et al. 2017b).
There have been several authors who have developed methodologies and software for the design and evaluation of central pivot irrigation systems such as Allen (1991); Valin et al. (2012); Moreno et al. (2012); Irmak, (2015); Almedia et al. (2017); Camejo et al. (2017); but they have as limitations the analysis of the topography of the terrain, the hydraulics of well, the curves of the centrifugal pumps, the types of emitters in the lateral and economic aspects. For this reason, the importance of developing software based on optimal methodologies that integrate all the variables for the design of central pivot irrigation systems is inevitable, and thus contribute to increase the efficiency and productivity of irrigation.
In this sense, the objective of this work is to develop a software for the hydraulic design of central pivot irrigation systems under specific operating conditions that include the hydrogeological, hydraulic, soil, agronomic and economic variables to obtain the design flow.
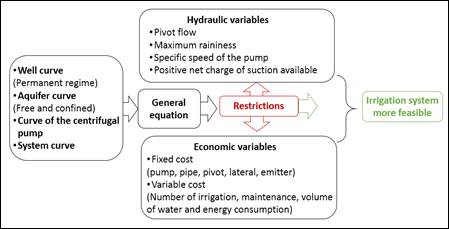
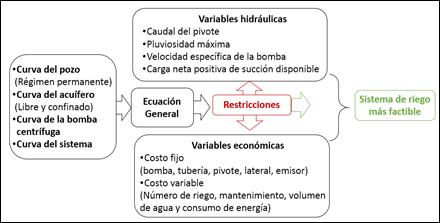
METHODSThe CurvePivot 2.0 software was implemented based on the mathematical model proposed by López et al. (2017b), attributing new working conditions, both for free and confined aquifers, considering a linear flow in a permanent regime in the well; as well as agronomic, operational and economic variables that determine the design of the central pivot as shown in flow diagram 1.
Flow diagram of the mathematical model.
The general equation of the mathematical model that integrates the combination of the aquifer curve, the well, the centrifugal pump and the curve of the irrigation system is explained by the following expression:
Where:- pump flow rate (m3 s-1)
- adjustment coefficients of the curve
- suction height of the static water level in the well (m)
- transmissivity (m2 s-1)
- "u" function of the well
- descent into the well (m)
- pressure of the last emitter on the lateral (m)
- roughness coefficient of the pipe
- internal diameter of the lateral pipe (m)
- integration from the start of the lateral to the distance rs (m)
- length of the irrigation lateral (m)
- height of the pivot (m)
- topographic difference between the point of the pivot and the extremity of the lateral (m)
- length of the emitter support pipe (m)
- internal diameter of the emitter support pipe (m)
- length of the suction and discharge pipe respectively (m)
- internal diameter of the suction and discharge pipe, respectively (m), the diameters are considered equal
- absolute roughness of the pipe (m)
- kinematic viscosity (m2 s-1)
- local loss coefficients (dimensionless)
The economic diameter for the design flow was determined in the expression (1), from the analysis of the fixed and operation costs of the system, using the commercial diameters existing in the market for central pivot irrigation systems, the expression is shown by the following equation:
Where:- total cost ($ ha-1 year-1)
- variable cost ($ ha-1 year-1)
- investment recovery factor (%)
- useful life of the investment (years)
The fixed costs in formula (2), are the sum of the costs of the pump, the impulsion pipe, the pivot, the lateral; as well as the type of emitter and pressure regulator. While the cost of the pump is a function of its power and the cost of the pivot depending on the diameter, according to studies by Montero et al. (2012), that are expressed by the equation:
Where:- cost of the impulse pipe ($)
- cost of the lateral ($), depending on the number of the towers and the diameter
- cost of the emitter type ($)
- cost of the pressure regulator ($)
- diameter of the pivot (mm)
The variable costs of formula (2) depend on the operation of the irrigation system, which is defined as the sum of the cost of energy, the cost of maintenance and the cost of water that are expressed by the equation:
Where:- cost of electricity consumed ($ ha-1 year-1)
- maintenance cost ($ ha-1 year-1)
- cost of water ($ ha-1 year-1)
- daytime work time per month (h)
- nightly work time per month (h); the irrigation area (ha)
- annual maintenance rate (%)
- purchase and installation price of the irrigation equipment ($)
- number of irrigations (dimensionless)
- efficiency of the pump (decimal)
- manometric height of the pump (m)
- specific weight of the water (9,806 kN m-³).
RESULT AND DISCUSSIONThe CurvePivot 2.0 software was developed. It allows the hydraulic design of central pivot irrigation systems for specific operating conditions, including hydrogeological, hydraulic, soil, agronomic and economic variables.
The program was designed with a simple interface that allows the user greater concentration on the content of the work. It was used as WPF technology contained in the Framework. Net in its version 4.0 and as a programming language C # was used in its version 5.0 and as Interface Development Enviroment Visual Estudio 2015, compatible with the Windows XP version onwards.
The user accesses in a logical and orderly manner indicated below from the information stored and entered as insert, select and import data from Microsoft Excel, remove and update data, diameters and materials of the pipes, types of towers, emitters and soils, sample of results, obtaining equations and curves of the system; sample of the point of operation of the system and runoff and print tables or figures. The software consists of three vital interfaces:
The first part, to the group of tabs which group the input fields (well, pump, pipe and central pivot) together with a result table, always visible to the user.
The second part is accessed through the run-off button on the navigation bar by entering the input fields for the runoff calculation and the result table.
The third part, the user accesses by the curved button of the navigation bar to access the curves generated by the pump and irrigation system.
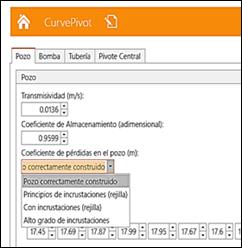
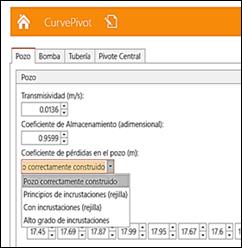
The following figures show an example of the features and operation of the CurvePivot 2.0 Software for the design of the center pivot. Figure 2 shows the main screen of the computer system; while, in Figure 3, the screen to enter the exploitation data of the well and the aquifer is observed. Some of those data are transmissivity, storage coefficient and the coefficients of losses of the well according to the constructive characteristics, as well as the groundwater levels of the aquifer.
Main screen of the computer system.
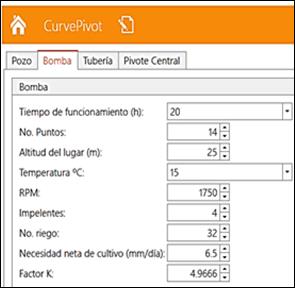
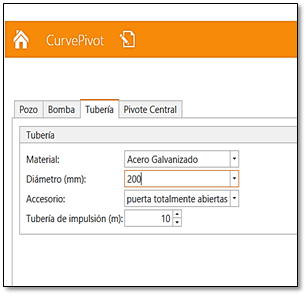
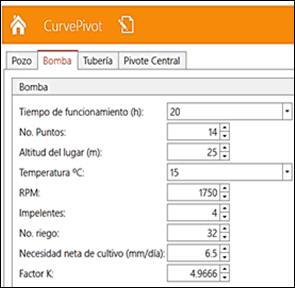
Figure 4 shows the data input screen of the centrifugal pump and agronomic variables. The pump curve, the operating time of the pump, number of impellers, irrigation number, maximum crop evapotranspiration, the coefficient of adjustment for variation of the price of fuel such as the K factor, among others are selected. Figure 5 shows the data entry screen of the discharge pipe.
Centrifugal pump data screen.
Discharge pipe data screen.
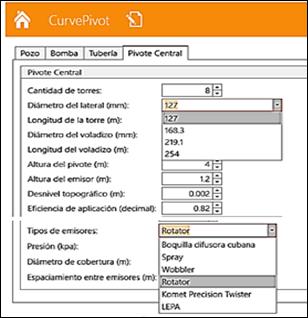
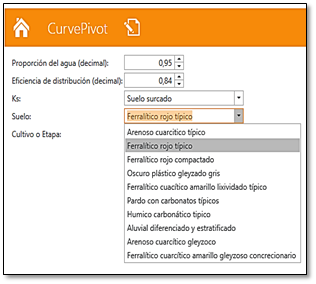
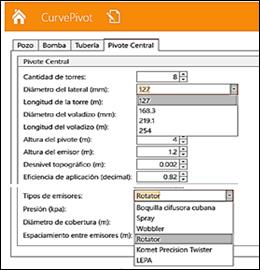
Figure 6 shows the data entry screen of the central pivot, the characteristics of the lateral pipe and emitter are selected, as well as the efficiency of the system. Figure 7 shows the data screen of the type of soil and crop to be irrigated.
Central pivot data screen.
Data screen of soil and crop type.
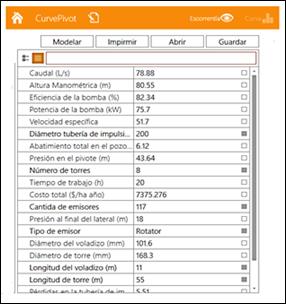
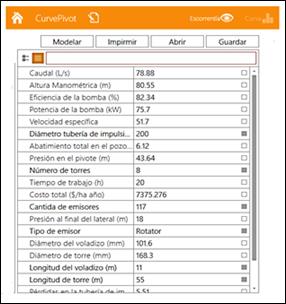
Figure 8 shows the results screen of the irrigation system, such as the depletion of the well, the operating parameters of the centrifugal pump, diameters and lengths of the pipes, working pressure, tower number, speed of the last tower and total cost of the irrigation system. This screen allows the most appropriate technical and economic selection to increase the efficiency of realization of irrigation projects with central pivots in real operating conditions. In this way, a reduction of expenses of material, human and energy resources and the time to perform the calculations and analysis is achieved, guaranteeing a greater technical and economic control of the design of the irrigation system with the minimum resources.
Results screen of the irrigation system.
Screen of the system operating point.
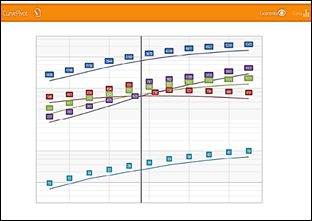
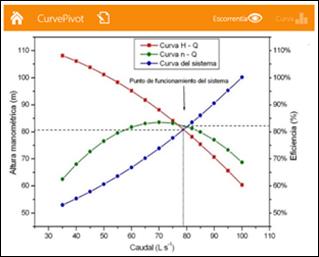
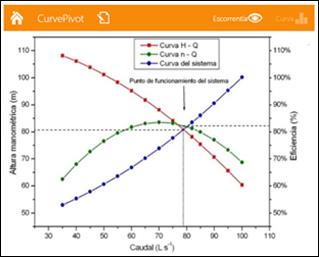
Figure 9 shows the curves of the operating point of the system (Hb v Q; η v Q and system curve), which facilitates the interpretation and visualization of the technical results for the increase in the useful life of the pump, from the stabilization of the operating point allowing lower maintenance cost due to the mechanical seals, bearings and less probability of misalignment of the shaft.
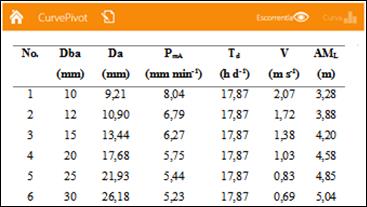
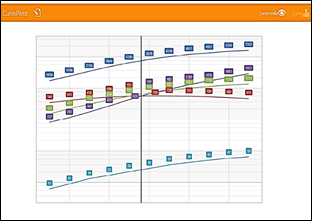
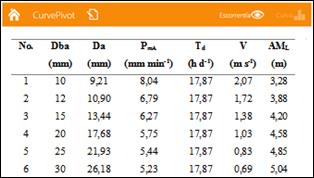
Figure 10 shows the results of the runoff at the end of the lateral. These values enable the appropriate selection of the emitter type to avoid runoff at the end of the lateral, depending on the type of emitter, which favours the rational use of water and energy in the irrigation system.
Runoff screen at the end of the lateral for the Rotator emitter
CONCLUSIONSThe CurvePivot 2.0 software was developed, which constitutes a technological innovation of utmost importance that allows realizing the optimal hydraulic design of central pivot irrigation systems for specific operating conditions.
The implementation of the CurvePivot 2.0 software allows the efficient elaboration of central pivot irrigation projects in less time, facilitates the interpretation and visualization of the economic technical results that have an impact on the increase of irrigation productivity; as well as the reduction of environmental impacts.
Traducir DocumentoSOFTWARE http://opn.to/a/qct5E
Software para el diseño hidráulico de los sistemas de riego de pivote central
[I] Universidad de Ciego de Ávila (UNICA), Facultad de Ciencias Técnicas, Centro de Estudios Hidrotécnicos, Ciego de Ávila, Cuba.
[II] Universidad Agraria de La Habana (UNAH), Facultad de Ciencias Técnicas, San José de las Lajas, Mayabeque, Cuba.
[*] Autor para correspondencia: Maiquel López-Silva. e-mail: maiquel@unica.cu
RESUMENSe elaboró un software CurvePivot 2.0 para el diseño hidráulico de los sistemas de riego de pivote central para las condiciones específicas de operación. El lenguaje de programación que se utilizó fue C# con una interfaz sencilla para el usuario. El programa se fundamentó en un modelo matemático que considera variables hidrogeológicas, hidráulicas, edáficas, agronómicas y económicas, a través del cual, se obtiene de forma rápida y eficaz el caudal de diseño con el menor costo de inversión y operación del sistema de riego. Además se determina la eficiencia y abatimiento del pozo, radio de influencia del pozo, los parámetros de la bomba centrífuga, el punto de funcionamiento del sistema, la pluviosidad en el extremo del lateral, los diámetros y longitudes de las tuberías, presión de trabajo, número de torre y la velocidad de la última torre. Esta herramienta ha sido utilizada en varias empresas agrícolas de la provincia de Ciego de Ávila, Cuba.
INTRODUCCIÓNLos software en las últimas décadas se han convertido en una herramienta eficaz en el diseño y manejo de los sistemas de riego, con el objetivo de maximizar la producción agrícola con un uso eficiente de los recursos naturales, como alternativa de bajo costo, rápida y fácil de utilizar (Ferreira y Assuncao, 2015; Kisekka et al., 2016; Pinheiro y Alves, 2017).
En el Ministerio de la Agricultura de la república de Cuba los sistemas de riego a presión constituyen los de mayor consumo de energía eléctrica entre el 18% al 20% (López et al., 2017a) y en países desarrollados supera el 20% (Kopp et al., 2016), lo que surge la necesidad de analizar el diseño, explotación y evaluación de estos sistemas. En Cuba en la década de los noventas se realizó el software “PIVOT” para el diseño de los sistemas de riego de pivote central por accionamiento hidráulico y eléctrico, pero este no contempla el parámetro hidrogeológico, el hidráulico en toda su extensión y los económicos (López et al., 2017b).
Han sido varios los autores que han desarrollado metodologías y software para el diseño y evaluación de los sistemas de riego de pivote central (Allen, 1991; Moreno et al., 2012; Valín et al., 2012; Montero et al., 2013; Pérez et al., 2015; Almeida et al., 2017; Camejo et al., 2017), pero tienen como limitantes el análisis de la topografía del terreno, la hidráulica de pozo, las curvas de las bombas centrífugas, los tipos de emisores en el lateral y aspectos económicos. Por tal motivo, es inevitable la importancia de elaborar software sustentado en metodologías óptimas que integren todas las variables para el diseño de los sistemas de riego de pivote central, y así contribuir al aumento de la eficiencia y productividad del riego.
En este sentido, el objetivo de este trabajo es desarrollar un software para el diseño hidráulico de los sistemas de riego de pivote central en condiciones específicas de operación que contemple las variables hidrogeológicas, hidráulicas, edáficas, agronómicas y económicas para la obtención del caudal de diseño.
MÉTODOSSe implementó el software CurvePivot 2.0 a partir del modelo matemático propuesto por (López et al., 2017b), atribuyéndoles nuevas condiciones de trabajo, tanto para acuíferos libres y confinados considerando un flujo lineal en régimen permanente en el pozo; así como variables agronómicas, operacionales y económicas que determinan el diseño del pivote central como se muestra en el diagrama de flujo 1.
Diagrama de flujo del modelo matemático.
La ecuación general del modelo matemático que integra la combinación de la curva del acuífero, el pozo, la bomba centrífuga y la curva del sistema de riego se expone mediante la siguiente expresión:
Donde:- caudal de la bomba (m3 s-1)
- coeficientes de ajuste de la curva
- altura de succión del nivel estático del agua en el pozo (m)
- transmisividad (m2 s-1)
- abatimiento en el pozo (m)
- presión del último emisor en el lateral (m)
- coeficiente de rugosidad de la tubería
- diámetro interno de la tubería del lateral (m)
- integración desde el inicio del lateral hasta la distancia rs (m)
- longitud del lateral de riego (m)
- desnivel topográfico entre el punto del pivote y la extremidad del lateral (m)
- longitud de la tubería de soporte del emisor (m)
- diámetro interno de la tubería de soporte del emisor (m)
- longitud de la tubería de succión e impulsión respectivamente (m)
- diámetro interno de la tubería de succión e impulsión respectivamente (m), considerados iguales los diámetros
- rugosidad absoluta de la tubería (m)
- viscosidad cinemática (m2 s-1)
- coeficientes de pérdidas locales (adimensional).
Se determinó el diámetro económico para el caudal de diseño en la expresión (1), apartir del análisis de los costos fijos y de operación del sistema, empleando los diámetros comerciales existentes en el mercado para los sistemas de riego de pivote central, la expresión se muestra mediante las siguientes ecuaciones:
Donde: - costo total ($ ha-1 año-1)
- costo variable ($ ha-1 año-1)
- factor de recuperación de la inversión (%)
- vida útil de la inversión (años).
Los costos fijos en la fórmula (2), es la suma de los costos de la bomba, la tubería de impulsión, el pivote, el lateral; así como el tipo de emisor y regulador de presión. Mientras que el costo de la bomba está en función de su potencia y el costo del pivote en dependencia del diámetro, según estudios realizados por (Montero et al., 2013), que se expresan mediante las ecuaciones:
Donde:- costo de la tubería de impulsión ($)
- costo del lateral ($), en función del número de las torres y el diámetro
- costo del tipo emisor ($)
- costo del regulador de presión ($)
- potencia de la bomba (kW)
- diámetro del pivote (mm).
Los costos variables de la fórmula (2), dependen de la operación del sistema de riego, que se define como la suma del costo de la energía, el costo de mantenimiento y el costo del agua que se expresan mediante la ecuación:
Donde:- costo de la energía eléctrica consumida ($ ha-1 año-1)
- costo de mantenimiento ($ ha-1 año-1)
- costo del agua ($ ha-1 año-1)
- tiempo de trabajo diurno al mes (h)
- tiempo de trabajo nocturno al mes (h)
- tasa anual de mantenimiento (%)
- precio de adquisición e instalación del equipamiento de riego ($)
- número de riegos (adimensional)
- eficiencia de la bomba (decimal)
- altura manométrica de la bomba (m)
- peso específico del agua (9,806 kN m-³)
RESULTADO Y DISCUSIÓNSe elaboró el software CurvePivot 2.0 que permite realizar el diseño hidráulico de los sistemas de riego de pivote central para las condiciones específicas de operación, que incluye variables hidrogeológicas, hidráulicas, edáficas, agronómicas y económicas.
El programa se diseñó con una interfaz sencilla que permite al usuario mayor concentración en el contenido del trabajo. Se utilizó como tecnología Windows Presentation Foundation contenida en el Framework en su versión 4.0 y como lenguaje de programación se utilizó C# en su versión 5.0 y como Interface Development Enviroment Visual Estudio 2015, compatible con la versión Windows XP en adelante.
El usuario accede de una forma lógica y ordenada que se indican a continuación a partir de la información almacenada e introducida como: insertar, seleccionar e importación de datos del Microsoft Excel, eliminar y actualizar datos, diámetros y materiales de las tuberías, tipos de torres, emisores y suelos, muestra de resultados, obtención de las ecuaciones y curvas del sistema; muestra del punto de operación del sistema y de la escorrentía e imprimir tablas o figuras. El software consta de tres interfaces vitales:
La primera parte, al grupo de pestañas las cuales agrupan los campos de entrada (pozo, bomba, tubería y pivote central) junto con una tabla de resultado, siempre visible para el usuario.
La segunda parte, se accede mediante el botón de escorrentía de la barra de navegación ingresando a los campos de entrada para el cálculo de la escorrentía y la tabla de resultado.
La tercera parte, se accede del botón curva de la barra navegación para acceder a las curvas generadas por la bomba y sistema de riego.
En las siguientes figuras se muestra un ejemplo de las características y funcionamiento del Software CurvePivot 2.0 para el diseño del pivote central. En la Figura 2 se muestra la pantalla principal del sistema informático; mientras que, en la Figura 3 se observa la pantalla para introducir los datos de explotación del pozo y el acuífero, como la transmisividad, coeficiente de almacenamiento y los coeficientes de pérdidas del pozo según las características constructiva, así como los niveles freáticos del acuífero.
Pantalla principal del sistema informático
Pantalla de datos del pozo.
En la Figura 4 se muestra la pantalla de introducción de datos de la bomba centrífuga y variables agronómicas, se selecciona la curva de la bomba, el tiempo de funcionamiento de la bomba, número de impelentes, número de riego, la evapotranspiración máxima del cultivo, el coeficiente de ajuste por variación del precio del combustible como el factor K, entre otros. En la Figura 5 se muestra la pantalla de introducción de datos de la tubería impulsión
Pantalla de datos de la bomba centrífuga
Pantalla de datos de la tubería impulsión.
La Figura 6 muestra la pantalla de introducción de los datos del pivote central, se seleccionan las características de la tubería del lateral y del emisor, así como la eficiencia del sistema. En la Figura 7 se muestra la pantalla de datos del tipo de suelo y cultivo a regar.
Pantalla de datos del pivote central.
Pantalla de datos del tipo suelo y cultivo.
En la Figura 8 se muestra la pantalla de resultados del sistema de riego, como abatimiento del pozo, los parámetros de funcionamiento de la bomba centrífuga, diámetros y longitudes de las tuberías, presión de trabajo, número de torre, velocidad de la última torre y costo total del sistema de riego. Esta pantalla permite la selección técnica y económica más adecuada para elevar la eficiencia de realización de los proyectos de riego con los pivotes centrales en condiciones reales de explotación. De este modo se logra una reducción de gastos de recursos materiales, humanos, energéticos y el tiempo para realizar los cálculos y análisis, garantizando un mayor control técnico y económico del diseño del sistema de riego con los mínimos recursos.
Pantalla de resultados del sistema de riego.
Pantalla del punto de funcionamiento del sistema.
En la Figura 9 se observa la obtención de las curvas del punto de funcionamiento del sistema (Hb v Q; η v Q y curva del sistema), que facilita la interpretación y la visualización de los resultados técnicos para el aumento de la vida útil de la bomba, a partir de la estabilización del punto de funcionamiento que repercute en menor costo de mantenimiento por los sellos mecánicos, rodamientos y menor probabilidad del desalineamiento del eje.
En la Figura 10 se exponen los resultados de la escorrentía en el extremo del lateral. Estos valores posibilitan la selección adecuada del tipo emisor para evitar la escorrentía en el extremo del lateral según el tipo emisor, que favorece al uso racional del agua y energía en el sistema de riego.
Pantalla de la escorrentía en el extremo del lateral para el emisor Rotator.
CONCLUSIONESSe elaboró el software CurvePivot 2.0 que constituye una innovación tecnológica de suma importancia que permite realizar el diseño hidráulico óptimo de los sistemas de riego de pivote central para las condiciones específicas de operación.
La implementación del software CurvePivot 2.0 permite la elaboración eficiente de los proyectos de riego con pivote central en menor tiempo, facilita la interpretación y la visualización de los resultados técnicos económicos que repercute en el aumento de la productividad del riego; así como la disminución de los impactos medioambientales.

