Translate PaperORIGINAL ARTICLE http://opn.to/a/hYS9y
Physical-Mechanical Properties of Pigeon Beans and Pods for the Design of a Sheller Machine
[I] Universidad Agraria de La Habana, Facultad de Ciencias Técnicas, Centro de Mecanización Agropecuaria (CEMA), San José de las Lajas, Mayabeque, Cuba.
[II] Universidad de Guayaquil, Facultad de Ciencias Agrarias, Guayaquil, Ecuador.
[III] Universidad Autónoma de Chiapas (UNACH), Escuela de Estudios Agropecuarios Mezcalapas, Chiapas, México.
[*] Correspondence to autor: Jeny Pérez Petitón. e-mail: jpetiton@unah.edu.cu
ABSTRACTThe study of the physical-mechanical properties is important for the design and construction of equipment and structures, for the management, collection, transportation, cleaning, classification, and agro industrial processing, as well as the input data to the theoretical model that bases the parameters of design and operation of the sheller machine. The work was carried out in the Agricultural Mechanization Center of the Faculty of Technical Sciences, Agrarian University of Havana, which had as objective to determine the physical-mechanical properties of the grains and green Gandul pods of the variety Gwailor-3, for its use of parameters of design and operation of a machine for the husking of green pigeon peas. Obtaining a width of the pods that oscillates between 12.5 and 15.8 mm, while the length is between 46.8 and 78.9 mm. The average friction values of the grains on rubber, wood and steel surfaces are 43.6º; 21.07º and 20.13º respectively and for the pods angles of 34.9º; 35.38º and 25, 95º.
INTRODUCTIONThe green pigeon pea [Cajanus cajan (L.) Mill sp.] Is native to India and later developed in Africa. It is one of the main vegetable crops of the tropics and sub-tropics, cultivated in approximately 50 countries in Asia, Africa and America, mainly interspersed with cereals. Its tolerance to drought and the ability to use residual moisture during the dry season make it an important crop (Sheldrake, 1984; Sandoval et al., 1991; Robledo, 2010).
The production of pigeon pea occupies the sixth place in comparison with other grain legumes, such as beans, peas and chickpeas. India is the largest producer with 3.4 million ha, followed by Myanmar (580 000 ha), China (60 000 ha) and Nepal (28 000 ha). About 95% of the production comes from South Asia, where 90% belongs to India, (Neme & Sheila, 1990; PASOLAC (Programa para la Agricultura Sostenible en Laderas de El Salvador), 2000; Robledo, 2010; Duke, 2012).
PASOLAC (Programa para la Agricultura Sostenible en Laderas de El Salvador) (2000), mentions that the pigeon-hound adapts well to low and medium altitudes ranging from 0-1500 meters above sea level; the optimal temperatures go from 18-35ºC and the precipitations from 700-2500 annual millimeters. The production of pigeon pea varies, according to Abrams & Julia (1973), depending on the technology used, being affected mainly by the type of soil and yields grain, yields between 568.18 and 1362 kg / ha depending on the pruning of the plants at a height between 0.8 and 10 meters, which increases the number of pods and the production of grains. Research carried out by (CIAT (Centro internacional de Agricultura Tropical), (1983), showed that one hectare of pigeon pea can produce an average of 4 to 5 tons of green grains, 1 ton of dry grain and 10 to 14 tons of green fodder. Riollano et al. (1962), reported that in Puerto Rico, 7.5 t / ha of green pods were harvested when using a density of 8 100 plants per hectare, sown in April.
According to Gane (1972), the mechanization of the processes to achieve greater efficiency in obtaining green beans during the shelling of beans, peas and pigeon pea, dating from the late eighteenth century when there were countless teams. The first revolutionary step occurred in 1885 when Madame Faure presented, at the Paris exhibition, her manual peeler machine, whose principles have been incorporated into all successful modern harvesters. Likewise, Scott, (1888), developed a design, which used power transmission mechanism, so that the activation of a lever generated the necessary rotations so that several blades made the process of cutting and separating the sheath and thus achieve separation of grains and pods.
The study of the physic-mechanical properties of grains provides scientific knowledge; essential to efficiently improve the design and construction of equipment and structures for the management, collection, transportation, cleaning, classification, and agro-industrial processing. However, according to Villamizar et al. (2004), there is little knowledge of the physical and mechanical characteristics of many products of plant origin. These properties constitute basic engineering information, essential for the design and optimization of machinery, equipment, structures and processes. The ignorance of these properties leads to inefficient agro industrial processes, where the design and construction of equipment, structures and agro-industrial processes are based on empirical knowledge and also in most cases, imported machinery is used adding higher investment costs. Castro, (1996) and Ospina & Julio (2001), state that the knowledge of the physical properties of grains and seeds, constitute a fundamental engineering information to adapt and operate machines, design and build storage structures, assemble adequate transportation systems; In addition, it is a fundamental parameter for packaging design, quality analysis and process control. This work aims to determine the physical-mechanical properties of grains and pods of green pigeon pea of the variety Gwailor-3, for use as parameters of design and operation of a machine for the shelling of green pigeon pea.
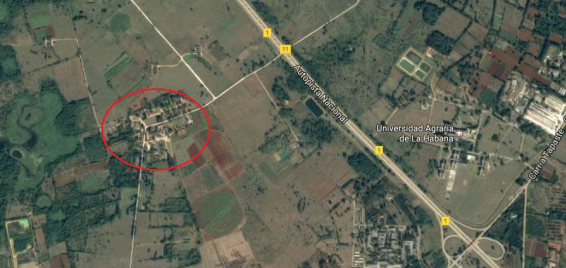
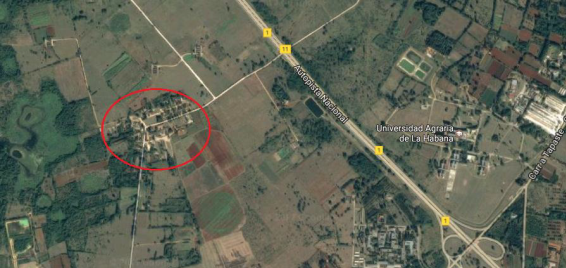
METHODSThe samples of green pigeon pea, were taken from the "Guayabal" farm, belonging to the Institute of Animal Sciences (ICA) located in the municipality of San José de las Lajas, Mayabeque Province (Figure 1).
Property Guayabal, sampling area.
For the sampling, the green pigeon pea (Cajanus Cajan) Gwailor-3 variety, was selected in full harvest maturity and the sampling was carried out at random.
The size of the sample was determined from a pre-experiment of Luyarati, (1997), through the following expression:
Where:- typical deviation or standard deviation;
- coefficient that depends on the confidence level and the number of samples, is determined for a student’s t distribution;
- maximum permissible error of the mean.
The arithmetic mean is determined as:
Among these properties are the dimensional characteristics of the grains and pods, as well as their mass and coefficients of friction in relation to surfaces of different material. Once the sample was selected, the dimensional characteristics of the pods and grains were determined by using a caliper of 0-150 mm, brand SIMCT., With an accuracy of 0.02 millimeters.
The dimensions that were measured in the pods were: the length of the pod (A), the peduncle (C) and the tip (B), the width of each pod (D) and the thickness of the pod €, (Figure 2).
Dimensions of the sheath of green pigeon pea.
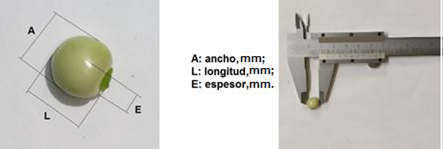
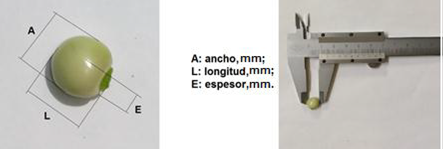
In the case of grains, the main dimensions were determined, length (L) (greater dimension), width (A) (medium dimension) and thickness (E) (smaller dimension), to a sample of 40 grains (Figure 3).
Dimensions of the grains of green pigeon pea.
The geometric mean (Dg) and arithmetic diameter (Da) was determined according to Mohsenin (1986).
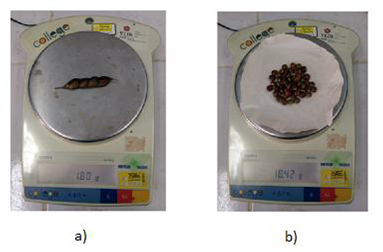
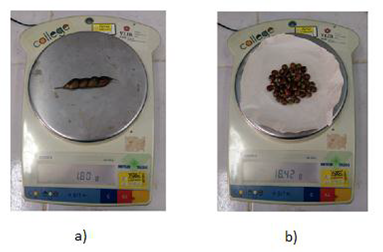
For the determination of the mass, a College scale balance was used, with a precision of 0.01 grams (Figure 4).
Weighing of samples, to) sheaths, b) grains.
The mass of the pods was determined individually and in the case of grains the methodology exposed by Vilche et al. (2003), weighing 5 sub-samples of 100 seeds each and extracting the result for 1 000 grains.
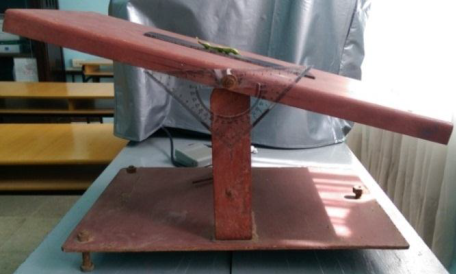
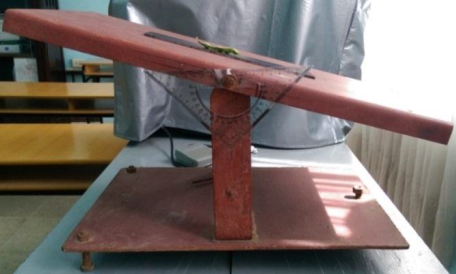
To determine the angle of friction, an inclined plane was used in which three surfaces were placed separately: steel, wood and rubber, completely clean (Figure 5).
Determination of the angle of friction for sheaths in the inclined plane.
The friction angle between the material of the pigeon pods and the surfaces described above was determined after placing the sheath on the surfaces and moving the ramp from the horizontal position (0 °) until obtaining the angle at which the pod begins to slide. This angle was measured with the semicircle graduated with precision up to 1º which is in the inclined plane.
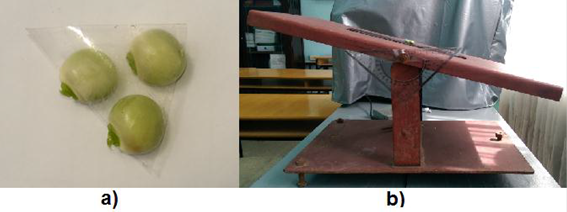
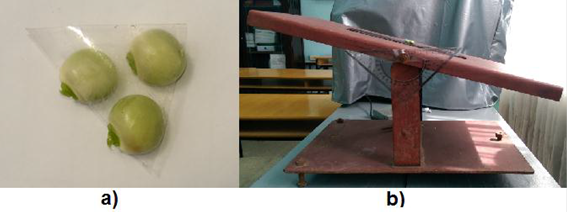
In the case of grains, the friction angle was determined applying the same procedure as for the pods, with the difference that the grains were grouped in groups of three with adhesive tape to prevent rolling (Figure 6)
Determination of the angle of friction of the grains, a) grains together with adhesive tape, b) inclined plane.
In both cases for the calculation of the coefficient of static friction (Cd) the following expression was used.
For the statistical mathematical processing of the data, the following programs were used: Statgraphics plus, version 5.1 (in Spanish) and Excel 2010. A descriptive analysis of the experimental data was carried out, determining the Arithmetic Mean ( ), the Typical Deviation of the mean (σ), the Error of the mean (Δr) and the Variation Coefficient (CV).
RESULTS AND DISCUSSIONThe result of the pre-experiments, it was obtained that the number of samples necessary for the realization of the experiment must be greater than 38. Taking 40 grains and 40 pods for the realization of the experiments, in order to guarantee greater precision in the final results.
In table 1, the results of the descriptive analysis performed on the grain and pod dimensions are appraised.
TABLE 1
Descriptive analysis starting from dimensions of grains and sheaths
| Granos | Vainas |
|---|
| | Ancho | Largo | Espesor | Ancho | Largo | Espesor |
|---|
| Media(mm) | 9,99 | 10,08 | 6,40 | 13,90 | 63,42 | 3,97 |
| Desv. Std. | 0,48 | 0,74 | 0,43 | 0,67 | 7,37 | 0,75 |
| Error de la media, % | 0,50 | 0,50 | 0,32 | 0,70 | 3,17 | 0,20 |
| Mínimo | 9,0 | 8,5 | 5,5 | 12,5 | 46,8 | 2,2 |
| Máximo | 10,8 | 11,7 | 7,1 | 15,8 | 78,9 | 6,0 |
| Rango | 1,8 | 3,2 | 1,6 | 3,3 | 32,1 | 3,8 |
In the previous table it is observed that the width of the pods ranges between 12.5 and 15.8 mm, the length is between 46.8 and 78.9 mm. Similar results were obtained by Sheahan (2012), who obtained pod lengths between 50.0 and 90.0 mm and widths of around 12.0 mm for this crop.
While for the grains the length, width, thickness, of the grains varies between 8.5 and 11.7 mm; 9.0 and 10.8 mm and 5.5 and 7.1 mm, respectively. The geometric mean diameter of 9.06 and the arithmetic of 8.63 mm, according to the three characteristic dimensions of the grains. The length, width, thickness and geometric diameter of pigeon seeds in India according to Khan et al. (2017), ranged from 4.9 to 6.9 mm, from 4.52 to 5.40 mm, from 4.10 to 4.70 mm and from 4.95 to 5.45 mm, respectively. Very similar results were obtained by Sobukola & Onwuka (2011), in the cultivation of the carob tree in the seed where the length, width, thickness and geometric mean diameter ranged between 10.00 and 11.72 mm; 7.80 to 9.22 mm; 4.00 to 4.85 mm; and 6.78 to 8.06 mm, respectively. Like Shirneshan (2011) in grains where the geometric mean diameter varied from 3.2 to 8.4 mm, respectively.
The above shows the commercial quality of the green locust bean, the Gwailor-3 variety.
In the frequency histograms obtained (Figure 6), we can see a close to normal distribution of the behaviors of the values of each variable for the case of grains.
Histograms of frequencies for the width, long and thickness of the grains.
In the case of the pods, in practical terms, significant differences are observed during the mutual comparison of the three magnitudes.
The lower error values of the mean are seen in the thickness characteristic, where it reaches 0.20 while the maximum values are found in the characteristic of the length, with a value of 3.17 (Table 1).
According to the frequency histograms obtained (Figure 7), we can see a close to normal distribution of the behaviors of the values of each variable.
Histograms of frequencies for the width, long and thickness of the sheaths.
The results obtained during the evaluation of the possibility of separation of the grains and pods are shown in table 2.
TABLA 2
Comparison of the thickness of the grains and the sheaths
| | p-valor | Intervalo de confianza | Sesgo estandarizado | Curtosis estandarizada |
|---|
| Espesor de los granos | 0,004 | 95% | -0,407 | -1,157 |
| Espesor de las vainas | 0,004 | 95% | 0,4810 | 0,537 |
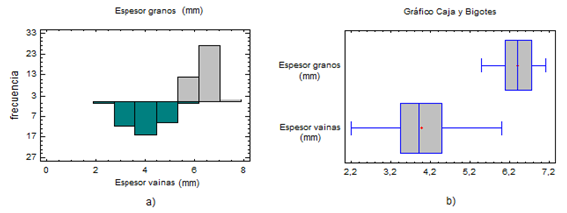
Since the p-value is less than 0.05, there are statistically significant differences during the mutual comparison of the thicknesses of grains and pods, for a confidence level of 95%. These results assume that the populations from which the samples come can be represented by normal distributions.
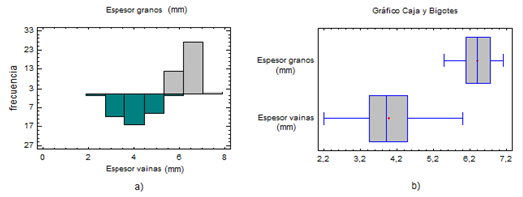
The above can be observed when analyzing the frequency of distribution of these dimensions and the box and whisker plot (Figure 8), observing the existence of significant differences between the compared dimensions of grains and pods.
a) Comparison between thickness of grains and sheaths, b) graph of boxes and mustaches.
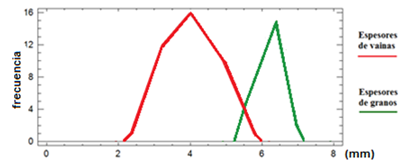
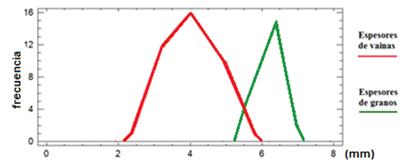
In Figure 9, the analysis of the variation curves of distribution of grain and pod dimensions is shown. It shows the existence of a small overlap between the thickness of the pods and the grains, which shows that it is possible to separate these two components, although not total, since a small part of the grains will pass through the rolls mixed with pods. This result does not affect the quality of the process taking into account that the smaller grains do not meet the dimensional conditions required in the final product.
Variation curves of distribution of the thickness of sheaths and grains.
The results of the descriptive analysis for the mass of the beans and pods are shown in table 3.
TABLE 3
Descriptive analysis of the data of the mensurations of the mass of the grains and the sheaths
| | Masa de 1000 granos | Masa de las vainas |
|---|
| Media (g) | 358,8 | 2,70 |
| Desv. std | 0,17 | 0,38 |
| Error de la media, % | 3,58 | 0,27 |
| Mínimo | 358,6 | 2,13 |
| Máximo | 359,0 | 3,37 |
| Rango | 0,04 | 1,24 |
As shown in Table 3, there are significant differences during the mutual comparison of the masses. The lower values of error of the mean are observed in the case of the pods, where it reaches a value of 0.27, while the maximum values are found in the grains, with a value of 3.58.
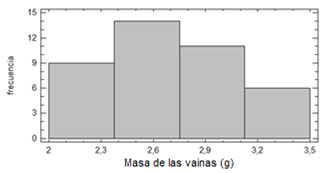
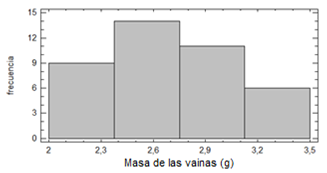
In the frequency histogram (Figure 10), a close to normal distribution of the behaviors of the values for the mass of the pods is observed.
Histogram of frequency for mass of sheaths.
The results of the determination of the friction angle of pods and grains on wood, rubber and steel are shown in Table 4.
TABLE 4
Certain statisticians for the angle of friction
| | Ángulo de fricción (º) |
|---|
| Granos | Vainas |
|---|
| Goma | Madera | Acero | Goma | Madera | Acero |
|---|
| Media (º) | 43.60 | 21.07 | 20.13 | 34.90 | 35.38 | 25.95 |
| Desvstd | 3.00 | 1.28 | 1.13 | 2.58 | 4.00 | 4.45 |
| Error de la media (%) | 4.36 | 2.11 | 2.01 | 1.75 | 1.77 | 1.30 |
| Mínimo | 39.0 | 19.0 | 18.0 | 28.0 | 28.0 | 18.0 |
| Máximo | 50.0 | 23.0 | 22.0 | 41.0 | 44.0 | 36.0 |
| Rango | 11.0 | 4.0 | 4.0 | 13.0 | 16.0 | 18.0 |
In Table 4 it can be seen that in the case of grains, the smaller average for the friction angle was obtained in the steel surface 20.13º, while the greater one is given for the rubber surface 43.6º. Similar results were obtained by Shirneshan (2011), for grains where the average values showed that the lowest static coefficient 0.32 occurred with galvanized steel and the highest 0.40 and 0.44 for rubber and canvas, respectively.
In turn, the frequency histograms (Figure 11) show a normal distribution of the behaviors of the values of each variable during the analysis of the friction angles between the grains and the different surfaces.
Histograms of angles of friction for grains in rubber surfaces, wood and steel.
Something similar happens for the case of the angle of friction of the pods, where the results show that the smallest average for the friction angle is obtained in the steel surface, with 25.95º, however in this case the highest values of angle of friction are given for the wood surface with 35.38º, although very similar to that of the rubber with 34.90º (Table 4).
Which means that the most convenient material to use is the rubber to cover the contact surfaces which will allow the feed to the sizing rollers progressively avoiding jamming.
Similarly, when the grain (43.60 º) has a friction angle greater than the sheath (34.90 º), we can advise that the separating screen of both be covered with rubber.
When analyzing the frequency histograms (Figure 12), a close to normal distribution of the behaviors of the values of each variable is observed.
Histograms of angles of friction for sheaths in rubber surfaces, wood and steel.
CONCLUSIONS
In the grains of green pigeon pea l variety Gwailor-3 the length, width, thickness, of the same varies between 8.5 and 11.7 mm; 9.0 and 10.8 mm and 5.5 and 7.1 mm, respectively. The geometric mean diameter of 9.06 and the arithmetic of 8.63 mm, guaranteeing its commercial quality.
The average friction angle of the grains on rubber, wood and steel surfaces is 43.6º; 21.07º and 20.13º respectively and for pods of 34.9º; 35.38º and 25.95º, which means that the most convenient material to use is the rubber to cover the contact surfaces, which will make it possible to feed the desicating rollers progressively, thus avoiding the jamming of the same, as well as the separation of pods and grains.
INTRODUCCIÓNEl gandul [Cajanus cajan (L.) Mill sp.], es originario de la India y más tarde se desarrolló en África. Es uno de los principales cultivos de legumbres de los trópicos y sub-trópicos, cultivándose en aproximadamente 50 países de Asia, África y América, principalmente intercalado con cereales. Su tolerancia a la sequía y la habilidad de usar humedad residual durante la estación seca lo hacen un cultivo importante (Sheldrake, 1984; Sandoval et al., 1991; Robledo, 2010).
La producción de gandul ocupa el sexto lugar en comparación con otras leguminosas de grano, tales como frijoles, guisantes y garbanzos. La India es el mayor productor con 3,4 millones de ha, seguido por Myanmar (580 000 ha), China (60 000 ha) y Nepal (28 000 ha). Alrededor del 95% de la producción proviene del sur de Asia, donde el 90% pertenece a la India, (Neme y Sheila, 1990; PASOLAC (Programa para la Agricultura Sostenible en Laderas de El Salvador), 2000; Robledo, 2010; Duke, 2012). PASOLAC (Programa para la Agricultura Sostenible en Laderas de El Salvador) (2000), menciona que el gandul se adapta bien a altitudes bajas y medias que van desde los 0-1500 metros sobre el nivel del mar; las temperaturas óptimas van desde los 18-35ºC y las precipitaciones desde 700-2500 milímetros anuales. Según Abrams y Julia (1973), la producción de gandul varía según la tecnología que se utilice, siendo afectada principalmente por el tipo de suelo y reporta rendimientos de granos entre 568,18 y 1362 kg/ha, dependiendo de la poda de las planta a una altura entre 0,8 y 10 metros, lo que aumenta el número de vainas y la producción de granos. Investigaciones realizadas por (CIAT (Centro internacional de Agricultura Tropical), (1983), mostraron que una hectárea de gandul puede llegar a producir como promedio de 4 a 5 toneladas de granos verdes, 1 tonelada de grano seco y de 10 a 14 toneladas de forraje verde. Riollano et al. (1962), reportó que en Puerto Rico, se cosechó 7,5 t/ha de vainas verdes al emplear una densidad de 8 100 plantas por hectárea, sembradas en abril.
Según Gane (1972), la mecanización de los procesos para lograr una mayor eficiencia en la obtención de los granos verdes durante el desgranado de frijol, arveja y gandul, datan desde finales del siglo XVIII cuando se realizaron un sinnúmero de equipos. El primer paso revolucionario ocurrió en 1885 cuando Madame Faure presentó, en la exhibición de París, su máquina desgranadora manual de arvejas, cuyos principios han sido incorporados en todas las cosechadoras exitosas actuales. Así mismo, Scott, (1888), desarrolló un diseño, que utilizó mecanismo de transmisión de potencia, para que el accionamiento de una palanca generara las rotaciones necesarias para que varias cuchillas hicieran el proceso de corte y separación de la vaina y así lograr la separación de granos y vainas.
El estudio de las propiedades físico-mecánicas de los granos aporta conocimiento científico; esencial para mejorar eficientemente el diseño y construcción de equipos y estructuras para el manejo, recolección, transporte, limpieza, clasificación, y procesamiento agroindustrial. Sin embargo, según Villamizar et al. (2004), es poco el conocimiento de las características físicas y mecánicas de muchos productos de origen vegetal. Estas propiedades constituyen información básica de ingeniería, esencial para el diseño y optimización de maquinarias, equipos, estructuras y procesos. El desconocimiento de estas propiedades lleva a procesos agroindustriales poco eficientes, donde el diseño y construcción de equipos, estructuras y procesos agroindustriales se basan en el conocimiento empírico y también, en la mayoría de los casos, se utiliza maquinaria importada agregando mayores costos de inversión. Castro, (1996) y Ospina y Julio (2001), plantean que el conocimiento de las propiedades físicas de los granos y semillas, constituyen una información fundamental de ingeniería para adecuar y operar máquinas, diseñar y construir estructuras de almacenamiento, montar sistemas adecuados de transporte; además, es un parámetro fundamental para el diseño de empaques, en el análisis de calidad y en el control de procesos. Por lo que este trabajo tiene como objetivo determinar las propiedades físico -mecánicas de los granos y vainas de gandul verde de la variedad Gwailor-3, para su utilización como parámetros de diseño y operación de una máquina para el desgranado de gandul verde.
MÉTODOSLas muestras de gandul se tomaron de la finca “Guayabal”, perteneciente al Intituto de Ciencias Animal (ICA) ubicado en el municipio San José de las Lajas, Provincia Mayabeque (Figura 1).
Finca Guayabal, zona de muestreo.
Para la toma de muestras se seleccionó la variedad de Gandul (Cajanus Cajan) Gwailor-3 en plena madurez de cosecha y el muestreo se realizó al azar.
El tamaño de la muestra se determinó a partir de un pre-experimento de Luyarati, (1997), a través de la siguiente expresión:
donde:- desviación típica o estándar;
- coeficiente que depende del nivel de confianza y del número de muestras, se determina para una distribución de t de student;
- error máximo permisible de la media.
La media aritmética se determina como:
Entre estas propiedades se encuentran las características dimensionales de los granos y vainas, así como su masa y los coeficientes de fricción con relación a superficies de diferente material. Una vez seleccionada la muestra se determinaron las características dimensionales de las vainas y granos, mediante el uso de un pie de rey de 0-150 mm, marca SIMCT., con una precisión de 0,02 milímetros.
Las dimensiones que se midieron en las vainas fueron: la longitud de la vaina (A), del pedúnculo (C) y de la punta (B), el ancho de cada vaina (D) y el espesor de la vaina (E), (Figura 2).
Dimensiones de la vaina de gandul verde.
En el caso de los granos se determinaron las dimensiones principales, longitud (L) (Dimensión mayor), ancho (A) (dimensión media) y espesor (E) (dimensión menor), a una muestra de 40 granos (Figura 3).
Dimensiones de los granos de gandul verde.
El diámetro medio geométrico (Dg) y aritmético (Da) se determinó según Mohsenin (1986).
Para la determinación de la masa se utilizó una balanza marca College, de precisión 0,01 gramos (Figura 4).
Pesaje de muestras, a) vainas, b) granos.
La masa de las vainas se determinó individualmente y en el caso de los granos se siguió la metodología expuesta por Vilche et al. (2003), pesándose 5 sub-muestras de 100 semillas cada una y se extrapolándose el resultado para 1 000 granos.
Para la determinación del ángulo de fricción se utilizó un plano inclinado en el que se colocaron por separado tres superficies: acero, madera y goma, completamente limpias (Figura 5).
Determinación del ángulo de fricción para vainas en el plano inclinado.
El ángulo de fricción entre el material de las vainas de gandul y las superficies anteriormente descritas se determinó después de colocar la vaina sobre las superficies y mover la rampa desde la posición horizontal (0º) hasta obtener el ángulo en que comienza la vaina a deslizarse. Este ángulo fue medido con el semicírculo graduado con precisión hasta 1º que se encuentra en el plano inclinado.
En el caso de los granos, el ángulo de fricción, se determinó aplicando el mismo procedimiento que para las vainas, con la diferencia de que los granos fueron unidos en grupos de tres con cinta adhesiva para evitar la rodadura (Figura 6)
Determinación del ángulo de fricción de los granos, a) granos unidos con cinta adhesiva, b) plano inclinado.
En ambos casos para el cálculo del coeficiente de fricción estático (Cd) se utilizó la siguiente expresión.
donde:- ángulo de fricción, (o).
Para el procesamiento estadístico matemático de los datos se emplearon los programas: Statgraphics plus, versión 5.1 (en español) y Excel 2010. Se realizó un análisis descriptivo de los datos experimentales, determinando la Media Aritmética ( X ), la Desviación Típica de la media (σ), el Error de la media (Δr) y el Coeficiente de Variación (C.V).
RESULTADOS Y DISCUSIÓNComo resultado de los pre-experimentos se obtuvo que el número de muestras necesario para la realización del experimento debe ser mayor de 38. Tomándose 40 granos y 40 vainas para la realización de los experimento, con el objetivo de garantizar mayor precisión en los resultados finales.
En la Tabla 1, se aprecian los resultados del análisis descriptivo realizado a las dimensiones de granos y vainas.
TABLA 1
Análisis descriptivo a partir de dimensiones de granos y vainas
| Granos | Vainas |
|---|
| | Ancho | Largo | Espesor | Ancho | Largo | Espesor |
|---|
| Media(mm) | 9,99 | 10,08 | 6,40 | 13,90 | 63,42 | 3,97 |
| Desv. Std. | 0,48 | 0,74 | 0,43 | 0,67 | 7,37 | 0,75 |
| Error de la media, % | 0,50 | 0,50 | 0,32 | 0,70 | 3,17 | 0,20 |
| Mínimo | 9,0 | 8,5 | 5,5 | 12,5 | 46,8 | 2,2 |
| Máximo | 10,8 | 11,7 | 7,1 | 15,8 | 78,9 | 6,0 |
| Rango | 1,8 | 3,2 | 1,6 | 3,3 | 32,1 | 3,8 |
En la tabla anterior se observa que el ancho de las vainas oscila entre 12,5 y 15,8 mm, el largo se encuentra entre 46,8 y 78,9 mm. Resultados similares fueron obtenidos por Sheahan (2012), que obtuvo longitudes de la vaina entre 50,0 y 90,0 mm y anchos de alrededor de 12,0 mm para este cultivo.
Mientras que para los granos el largo, ancho, espesor, de los granos varía entre 8,5 y 11,7 mm; 9,0 y 10,8 mm y 5,5 y 7,1 mm, respectivamente. El diámetro medio geométrico de 9,06 y el aritmético de 8,63 mm, según las tres dimensiones características de los granos. La longitud, el ancho, el grosor y el diámetro geométrico de las semillas de guandúl en la India según Khan et al. (2017), variaron de 4,9 a 6,9 mm, de 4,52 a 5.40 mm, de 4,10 a 4,70 mm y de 4,95 a 5,45 mm, respectivamente. Resultados muy similares obtuvieron Sobukola y Onwuka (2011), en el cultivo del algarrobo en la semilla donde la longitud, el ancho, el grosor y el diámetro medio geométrico oscilaron entre 10,00 a 11,72 mm; 7,80 a 9,22 mm; 4,00 a 4,85 mm; y 6,78 a 8,06 mm, respectivamente. Al igual que Shirneshan (2011) en granos donde el diámetro medio geométrico varió de 3,2 a 8,4 mm, respectivamente.
Lo anteriormente expuesto evidencia la calidad comercial del grano de gandul verde la variedad Gwailor-3.
En los histogramas de frecuencia obtenidos (Figura 6), se aprecia una distribución cercana a la normal de los comportamientos de los valores de cada variable para el caso de los granos.
Histogramas de frecuencias para el ancho, largo y espesor de los granos.
En el caso de las vainas, en términos prácticos, se observan diferencias significativas durante la comparación mutua de las tres magnitudes.
Los menores valores de error de la media se aprecian en la característica del espesor, donde alcanza 0,20 mientras que los valores máximos se encuentran en la característica del largo, con un valor de 3,17 (Tabla 1).
Según los histogramas de frecuencia obtenidos (Figura 7), se aprecia una distribución cercana a la normal de los comportamientos de los valores de cada variable.
Histogramas de frecuencias para el ancho, largo y espesor de las vainas.
Los resultados obtenidos durante la evaluación de la posibilidad de separación de los granos y vainas se muestran en la tabla 2.
TABLA 2
Comparación de los espesores de los granos y las vainas
| | p-valor | Intervalo de confianza | Sesgo estandarizado | Curtosis estandarizada |
|---|
| Espesor de los granos | 0,004 | 95% | -0,407 | -1,157 |
| Espesor de las vainas | 0,004 | 95% | 0,4810 | 0,537 |
Como el p-valor es menor que 0,05, existen diferencias estadísticamente significativas durante la comparación mutua de los espesores de granos y vainas, para un nivel de confianza del 95%. Estos resultados asumen que las poblaciones de las cuales provienen las muestras pueden ser representadas por distribuciones normales.
Lo anterior se puede observar al analizar la frecuencia de distribución de dichas dimensiones y el gráfico de cajas y bigotes (Figura 8), observándose la existencia de diferencias significativas entre las dimensiones comparadas de granos y vainas.
a) Comparación entre espesores de granos y vainas, b) gráfico de cajas y bigotes.
En la Figura 9, se muestra el análisis de las curvas variacionales de distribución de las dimensiones de granos y vainas. En ella se exhibe la existencia de un pequeño solapamiento entre el espesor de las vainas y los granos, lo que demuestra que es posible la separación de estos dos componentes, aunque no total, ya que una pequeña parte de los granos pasarán a través de los rodillos mezclados con las vainas. Este resultado no afecta la calidad del proceso teniendo en cuenta que los granos más pequeños no cumplen las condiciones dimensionales requeridas en el producto final.
Curvas variacionales de distribución del espesor de vainas y granos.
Los resultados del análisis descriptivo para la masa de los granos y las vainas se muestran en la tabla 3.
TABLA 3
Análisis descriptivo de los datos de las mediciones de la masa de los granos y las vainas
| | Masa de 1000 granos | Masa de las vainas |
|---|
| Media (g) | 358,8 | 2,70 |
| Desv. std | 0,17 | 0,38 |
| Error de la media, % | 3,58 | 0,27 |
| Mínimo | 358,6 | 2,13 |
| Máximo | 359,0 | 3,37 |
| Rango | 0,04 | 1,24 |
Como se muestra en la Tabla 3, existen diferencias significativas durante la comparación mutua de las masas. Los valores menores de error de la media se observan en el caso de las vainas, donde alcanza un valor de 0,27, mientras que los valores máximos se encuentran en los granos, con un valor de 3,58.
En el histograma de frecuencia (Figura 10), se observa una distribución cercana a la normal de los comportamientos de los valores para la masa de las vainas.
Histograma de frecuencia para masa de vainas.
Los resultados de la determinación del ángulo de fricción de vainas y granos sobre madera, goma y acero se muestran en la Tabla 4.
TABLA 4
Estadígrafos determinados para el ángulo de fricción
| | Ángulo de fricción (º) |
|---|
| Granos | Vainas |
|---|
| Goma | Madera | Acero | Goma | Madera | Acero |
|---|
| Media (º) | 43,60 | 21,07 | 20,13 | 34,90 | 35,38 | 25,95 |
| Desvstd | 3,00 | 1,28 | 1,13 | 2,58 | 4,00 | 4,45 |
| Error de la media (%) | 4,36 | 2,11 | 2,01 | 1,75 | 1,77 | 1,30 |
| Mínimo | 39,0 | 19,0 | 18,0 | 28,0 | 28,0 | 18,0 |
| Máximo | 50,0 | 23,0 | 22,0 | 41,0 | 44,0 | 36,0 |
| Rango | 11,0 | 4,0 | 4,0 | 13,0 | 16,0 | 18,0 |
En la Tabla 4 se puede apreciar que en el caso de los granos la media menor para el ángulo de fricción se obtuvo en la superficie acero 20,13º, mientras que la mayor está dado para la superficie de goma 43,6º. Resultados similares obtuvo Shirneshan (2011), para granos donde los valores medios mostraron que el coeficiente estático más bajo 0.32 ocurrió con acero superficie galvanizada y los más altos de 0,40 y 0,44 para la goma y lona, respectivamente.
A su vez los histogramas de frecuencia (Figura 11), muestran una distribución normal de los comportamientos de los valores de cada variable durante el análisis de los ángulos de fricción entre los granos y las diferentes superficies.
Histogramas de ángulos de fricción para granos en superficies de goma, madera y acero.
Algo similar ocurre para el caso del ángulo de fricción de las vainas, donde los resultados muestran que la media menor para el ángulo de fricción se obtiene en la superficie de acero, con 25,95º, sin embargo en este caso los mayores valores de ángulo de fricción están dados para la superficie de madera con 35,38º, aunque muy similar al de la goma con 34,90 º (Tabla 4).
Lo que significa que el material más conveniente a utilizar es la goma para cubrir las superficies de contacto lo que permitirá realizar la alimentación a los rodillos desgranadores de forma progresiva evitando así el atasco de los mismos.
De igual forma al poseer el grano (43,60 º) un ángulo de fricción mayor que la vaina (34,90 º), podemos aconsejar que la zaranda separadora de ambos esté revestida de goma.
Al analizar los histogramas de frecuencia (Figura 12), se observa una distribución cercana a la normal de los comportamientos de los valores de cada variable.
Histogramas de ángulos de fricción para vainas en superficies de goma, madera y acero.
CONCLUSIONES
En los granos de gandul verde variedad Gwailor-3 el largo, ancho, espesor, de los mismos varía entre 8,5 y 11,7 mm; 9,0 y 10,8 mm y 5,5 y 7,1 mm, respectivamente. El diámetro medio geométrico de 9,06 y el aritmético de 8,63 mm, garantizando su calidad comercial.
El ángulo de fricción medio de los granos sobre superficie de goma, madera y acero es de 43,6º; 21,07º y 20,13º respectivamente y para vainas de 34,9º; 35,38º y 25,95º, lo que significa que el material más conveniente a utilizar es la goma para cubrir las superficies de contacto lo que permitirá realizar la alimentación a los rodillos desgranadores de forma progresiva evitando así el atasco de los mismos, así como la separación de las vainas y granos.
 ), the Typical Deviation of the mean (σ), the Error of the mean (Δr) and the Variation Coefficient (CV).
